Have Japanese Share Prices Recovered?
Economy- English
- 日本語
- 简体字
- 繁體字
- Français
- Español
- العربية
- Русский
A Fourth Postbubble Peak?
More than a quarter-century has passed since the last trading session of the year on December 29, 1989, when bubble-period share prices hit their peak. After American share prices collapsed in October 1929 and the country entered the Great Depression, it took 25 years for the Dow Jones average of 30 industrials on the New York Stock Exchange to recover and surpass its precollapse high. By contrast, over the last 25 years, the 225-issue Nikkei average on the Tokyo Stock Exchange had only recovered to the 17,000 level at the end of 2014, just 45% of the 1989 peak of 38,915.87. In terms of leading stock indicators, therefore, the collapse of the bubble economy and subsequent long-term slump in Japan are even more serious than the Great Depression in the United States.
It should be noted, however, that the low (closing price) over this 25-year period was 7,607.88, posted on April 28, 2003—a mere fifth of the peak. The current level is more than double this price. Graphs of Japanese share prices since the collapse of the bubble reveal that there were three recovery periods in the following decade, coming in 1993, 1996, and 2000. In all cases, the Nikkei average exceeded 20,000, but it was not able to make it into the high end of that range.

In all three cases, the recovery came immediately after a fairly large write-off of the nonperforming bank loans that were a negative legacy of the collapse of the bubble. (In 1993, it was a spate of nonbank bankruptcies and the first write-off by the housing-loan companies known as jūsen; in 1996, bankruptcies among the shinkin banks, credit unions, and second-tier regional banks, and the second jūsen write-off ; in 2000, the passage of two financial laws that allowed public funds to be pumped into major banks.) In the 1990s, Japan was buoyed by a strong global economy after exhausting its own strength dealing with financial instability. This was not repeated after 2000, though, due to events including the collapse of the IT bubble and the September 11 terrorist attacks in the United States.
In May 2003, Japan carried out its final cleanup of nonperforming bank loans under the Takenaka Plan, named for then Financial Services Minister Takenaka Heizō. The nation then embarked on a lengthy economic recovery that surpassed even the Izanagi boom of the 1960s, thanks in part to massive intervention on foreign exchange markets. While this was taking place, however, the global economy itself was in a slump, and there had been significant changes to domestic shareholding structures since the write-off of nonperforming assets. While the Nikkei average was able to clear the 18,000 line in the second half of the decade, the rally did not last. The Lehman Brothers collapse combined with rigid monetary policy at the Bank of Japan caused the Nikkei average to once again sink into the 7,000 range.
The Quest for Higher Share Prices
In the second half of 2012, as the rule of the Democratic Party of Japan was coming to an end, the market began to expect a significant reorientation in monetary policy under a new BOJ governor. The rebound did not wait for the new Abe government or new bank leadership; share prices began to rise as soon as the dissolution of the Diet became a possibility, and they continued to increase when BOJ chief Kuroda Haruhiko announced large-scale quantitative easing in April 2013. At the end of 2014, the Nikkei average reached 18,000 for a brief moment before turning downward and settling into the 17,000 range. [In mid-February 2015 the index again cleared the 18,000 mark, where it remains as of publication of this article.—Ed.]
While these are the highest levels seen this century , they remain very low compared with the bubble period, and below even the levels seen in the slump of the 1990s. The question, however, is whether share prices are too high or too low. Has Abenomics been effective or not? Digging deeper, are share prices the objective of economic policy or merely a barometer of recovery? A key question here is what determines share prices in Japan. Some explain prices as a report card for the government, something that was often heard during the run-up to and aftermath of the December 2014 election, but this theory cannot be given credence without a clear definition of what share prices signify.
At a press conference after the April 4, 2013, Policy Board meeting where the BOJ decided its program of quantitative and qualitative easing, Governor Kuroda spelled out the central bank’s map to guide Japan out of deflation: quantitatively expanding base money to pump up the money supply, raising Japanese asset prices in general, and increasing investment by expanding credit. The aims of this are easier to understand in connection with the “first arrow” of Abenomics, which seeks to stimulate investment by increasing not the level of asset prices, but their total value.
The Nikkei average is an index of shares from 225 representative companies that functions similarly to the Dow Jones average (30 industrial issues on the NYSE), and is calculated as an arithmetic average of their prices. It serves as a convenient indicator for comparing share price levels over time, but is only an indicator of level. A different indicator is required to track changes in the scale of assets on the stock market itself.
Has Japan Recovered from the Bubble?
The most commonly used yardstick is market capitalization, calculated by multiplying the number of outstanding shares by their prices. Viewed over time, the market capitalization of the First Section of the Tokyo Stock Exchange tells a completely different story than the Nikkei average.

A look at market capitalization levels over time shows that the stock market has indeed recovered in size to its bubble-period levels. As figure 2 shows, market capitalization slumped during the 1990s because of the disappearance of the “bubble” portion, but the foreign-exchange intervention and easing that began in 2003 induced a recovery. Asset values again trended down after the Lehman Brothers collapse, but they have recovered during the current monetary easing phase.
Market capitalization has moved at odds with the average share price because financial institutions began tackling the cleanup of nonperforming loans around 1990, prompting companies to turn to the capital market for fund raising, moving away from loan intake. Simply put, more companies are going public, and they have more options for doing so with the emergence of alternative markets like JASDAQ and Mothers. The absolute number of outstanding shares has thus increased, while funds have kept flowing into stocks. The scale of Japan’s market is indeed expanding, though still not to the levels of markets in other countries.
This begs the question of what share price would indicate that Japan has fully surpassed the bubble period peak. A rough calculation shows that there is still almost 40% to go from the levels of late December 2014 for the market capitalization of the TSE’s First Section to reach the ratio to nominal GDP that it marked at the end of 1989. Mechanically applying this to the Nikkei average would indicate a target somewhere above 24,000. After the collapse of the bubble economy, there were several times in the late 1990s when the market peaked in the 20,000−22,000 range. Psychologically, a Nikkei average of 24,000 would feel like a recovery from the long postbubble slump.
Sentiment Is Not Still There
Stock asset values have almost recovered. Does this mean that Abenomics has been a success? Not necessarily, because share prices in Japan are now influenced in no small part by external factors in the form of foreign funds.
During the cleanup of nonperforming bank loans that began around 1990, many of Japan’s “cross-shareholding” arrangements were unwound, and the ratio of shares held by banks declined by half. Global investment funds came in to make up for this. Today, they hold the largest share of any investor sector. Foreign investment trends have come to considerably impact Japanese share prices.

The money invested is the same whether it comes from Japanese investors or from abroad, but the assessments made by these two investor types are very different. From the perspective of foreign funds, which are looking at investment on a global basis, Japanese stocks are a bargain because QE has weakened the yen, effectively slashing prices when they are converted to foreign currencies (while also paving the way for higher profits at top-flight Japanese exporters that are international blue chip stocks). It is only natural that overseas investors will increase their Japan buys in this environment. However, these players decide on the ratios for their investment in different areas (with their portfolios, obviously, denominated in dollars) and are mechanically increasing their purchases of Japanese shares because relative prices have declined thanks to the exchange rate and other factors. This is why share prices have become so volatile and move in ways that are unrelated to domestic circumstances in Japan.
What about domestic funding? Currently, the sectors holding surplus funds are households and nonfinancial corporations, but neither has dramatically increased investment in domestic securities. To put it concisely, the country still has a deflationary mindset. It has yet to reach the stage at which people expect long-term rises in asset prices and economic growth. Many actors have concluded that, in this environment, it is wiser to hold cash than to invest.
Quantitative easing has certainly sparked a recovery in asset prices. However, the stock market movements indicate that it has yet to stimulate investment behavior and economic activity. We are still a long way from the virtuous cycle in which higher asset prices stimulate the economy, increase corporate demand for funds, and result in higher performance that in turn brings more domestic and overseas money to the market. In this sense, it is still too soon to call Abenomics a success.
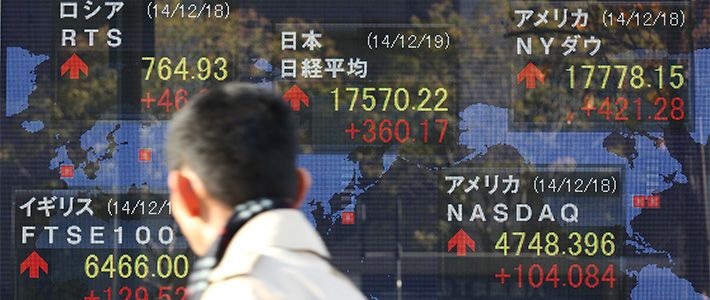
(Originally written in Japanese and published on December 26, 2014. Banner photo: Share price board on the Tokyo streets showing a slow and steady recovery. © Jiji.)
bubble Abenomics stock quantitative easing QE Tokyo Stock Exchange shares Nikkei average Kuroda Dow Jones