Facing Japan’s Extreme Weather Challenges
The Long-Term Macroeconomic Impact of Natural Disasters
Economy Society- English
- 日本語
- 简体字
- 繁體字
- Français
- Español
- العربية
- Русский
Abnormal weather patterns, such as localized downpours and floods, super typhoons, and scorching heat waves are occurring with greater frequency all over Japan. One factor behind this trend may be global warming, which the Kyoto Protocol (adopted in December 1997) has attempted to address by lowering greenhouse-gas emissions. There are no quick and easy ways to counter the warming of the globe, however; the measures taken can only mitigate the situation over the course of several decades or centuries. This suggests that attempts to control natural disasters and abnormal weather conditions over the short term are unlikely to have much effect.
How do natural disasters affect a nation’s economy over the long run? Using theories of economic growth, I will attempt a macroeconomic analysis of climate change.
Macroeconomic Impact of Natural Disasters
The first task in undertaking such an analysis is to determine which indices are most appropriate for measuring “macroeconomic change.” Macroeconomic trends indicate where a country’s economy and society are headed and are usually gauged by gross domestic product, consumer prices, interest rates, fiscal deficit, and other figures. Rather than examining all of these indices, I will focus on the relationship between natural disasters and per capita GDP.(*1)
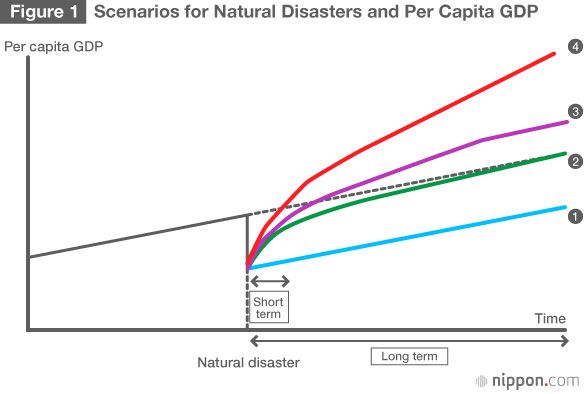
Table 1. Impact of Natural Disasters on per Capita GDP
| Scenario | Short-term impact | Long-term impact | |
|---|---|---|---|
| Level | Level | Growth rate | |
| 1 | Minus | Minus | Unchanged |
| 2 | Minus | Unchanged | Unchanged |
| 3 | Minus | Plus | Unchanged |
| 4 | Minus | Plus | Plus |
Figure 1 outlines four scenarios for per capita GDP (vertical axis) following a natural disaster as a factor of time (horizontal axis). The trend line shows gradual, steady growth as a byproduct of technological advances, with a major disaster disrupting this trend and causing growth to dip temporarily. The curve soon returns to growth as before (scenarios 1 to 3) or at an even higher pace (scenario 4). Table 1 summarizes the short- and long-term impact of a major disaster on per capita GDP under the four scenarios.
An example of scenario 1 is the devastating 2010 earthquake in Haiti, which took over 300,000 lives and destroyed many buildings in the capital of Port-au-Prince and other cities. While there has been a gradual return to growth, the country has yet to recover fully, still being plagued by epidemics, lack of housing, breakdown in public safety, looting, and other problems.
Examples of scenarios 3 and 4 include the Great Kanto Earthquake of 1923 and the Great Hanshin-Awaji Earthquake of 1995 in Japan and the Lisbon Earthquake of 1775 in Portugal. These major disasters prompted a fundamental shift both in socioeconomic institutions and in people’s thinking, as a result of which the affected areas recovered quickly(*2). As these examples show, some countries have been able to make steady progress toward reconstruction after a natural disaster, while others have been slow to achieve a recovery.
“Growth Accounting” Analysis
As shown above, natural disasters and abnormal weather conditions are exogenous factors that are, to a large extent, unavoidable facts of life. From the perspective of economics, the most desirable development after a major disaster would be scenario 3 or 4. What conditions must be met for either of these scenarios to materialize? I will examine this point using the tools of growth accounting, which can be used to analyze the factors underlying economic growth.
Per capita GDP can be expressed as a production function, as follows:
(1) yt=Atktαhtβ
In the equation above, yt is the “per capital GDP” for a given term t; kt is the “physical capital” during t; ht is the “human capital” during t; and At is “total factor productivity” (technological advances, etc.), in other words, factors that contribute to productivity other than physical and human capital.(*3)
From equation (1), we can derive a second growth accounting equation:
(2) growth rate of yt = growth rate of At + α × growth rate of kt + β × growth rate of ht
This can statistically give an idea of the degree to which per capita GDP growth will be affected when a natural disaster has an impact on increases in total factor productivity (At), per capita physical capital (kt), and per capita human capital (ht).(*4) Perhaps the most significant of these growth rates is the one for total factor productivity, which indicates the rate of technological progress.
As mentioned above, total factor productivity includes factors like technological advances and economic climate that contribute to production, apart from physical and human capital. In other words, it accounts for the difference in output when the same machines (physical capital) and same-skilled workers (human capital) are applied to a manufacturing activity. While there is quite an extensive range of components that make up total factor productivity, I will focus here on “technological innovation in production equipment” and “interpersonal trust,” two factors that have gained prominence among economists in recent years as factors of production.(*5)
Post-Disaster Technological Innovation
One way that a natural disaster can positively affect total factor productivity is when it leads to the replacement of damaged, outdated production facilities and physical infrastructure with state-of-the-art facilities and infrastructure. This is an example of how natural disasters can lead to “creative destruction” (Skidmore and Toya 2002; Cuaresma, Hlouskova, and Obersteiner 2008). A change in the quality—but not quantity—of physical capital can boost per capita GDP, potentially resulting in the curves under scenarios 3 and 4 of Figure 1.
Table 2. New Facilities Game
| Young employee | |||
| New equipment | Old equipment | ||
| Old employee | New equipment | [ 4 (=6-2), 4 (=6-2) ] | [ 2, 1 (=3-2) ] |
| Old equipment | [1 (=3-2), 2 ] | [ 2, 2 ] | |
Note: Figures in brackets indicate respective benefits for young and old employee.
We can examine this phenomenon using a simple game-theory framework. Table 2 shows the potential benefits of introducing new production facilities. Let us take the case of a company with one young and one old employee that is undertaking production using old equipment. Under such conditions, the benefits for both employees are “2.”
Let us assume that new equipment is introduced for both employees at the same time. Because the new machines are more efficient, the benefits rise to 6 for both employees. If new equipment is introduced for just one employee, the additional functions of the new machines are only partly used, resulting in gains of only 3. Because there is a need for the employees to receive training to handle the new equipment, its introduction incurs costs of 2 for both employees.
These costs and benefits are summarized in Table 2. The figures in brackets are the respective benefits to the young and old employee. While the biggest benefits result from both employees using new equipment, this scenario—along with the situation in which both employees keep their old equipment—is at a Nash equilibrium, meaning that neither has anything to gain by changing only his or her own strategy.
This suggests that even if both employees are aware that they could boost productivity by introducing new equipment, they would be inclined to continue their activities using existing, older machines.
The table also indicates that if the old equipment is destroyed by a natural disaster, it could, in the long run, lead to greater efficiencies and higher economic growth—even if the damage causes economic and social turmoil and stagnation in the short term.
Importance of Interpersonal Trust
The index used here is derived from the “interpersonal safety and trust” index developed by the International Institute of Social Studies in its Indices of Social Development. The ISD is based on a variety of societal data collected between 1990 and 2010 from 193 countries, which, as of 2014, have been grouped into six categories.(*6) “Interpersonal safety and trust” is a measure of the extent to which individuals feel they can rely on those whom they have not met before. A high figure indicates a high degree of trust and a safe and secure society, which are all conditions conducive to faster economic growth.
One way in which natural disasters can heighten interpersonal trust is by promoting cooperation among neighbors and communities to address such tasks as disaster reduction and prevention and rescue operations . This occurs because climatic calamities are too big to be dealt with by individuals on their own.
Disasters can also spark feelings of sympathy among the general public, prompting many to volunteer or make donations to help those affected. Economies in which there is little societal trust have higher transaction costs, which hinder economic development. A disaster can lead to stronger interpersonal ties and thus facilitate growth, potentially producing the curves of scenarios 3 or 4 in Figure 1.
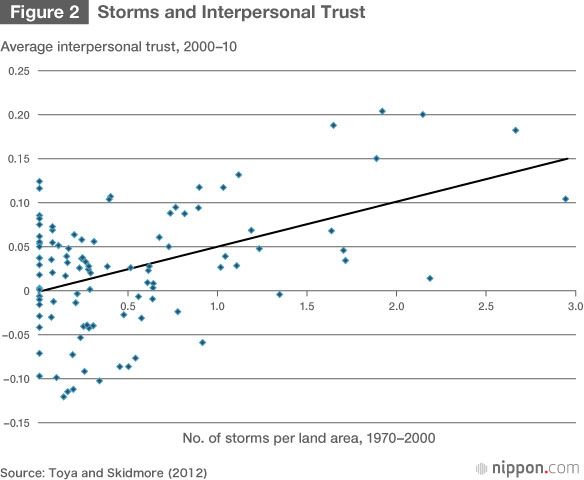
Figure 2 charts data from 104 countries on the number of storms (extreme winds) between 1970 and 2000 per land area (horizontal axis) and the average levels of interpersonal trust between 2000 and 2010 (vertical axis) (Toya and Skidmore 2012 ). The pattern shows a positive correlation between the number of storms experienced in the past and levels of interpersonal trust.
Building a Disaster-Resilient Society
In the above I have attempted to show that natural disasters can have a positive, long-term macroeconomic impact if they lead to technological innovation in production facilities and stronger interpersonal trust. The conclusions suggest, moreover, that the anticipated rise in the frequency of natural disasters in the years ahead could produce a more cohesive and trusting society. The findings also point to the importance of efforts to prevent natural disasters from causing stagnation and to encourage robust growth through the building of a more resilient economy and society.
REFERENCES
Cuaresma C., J. Hlouskova, and M. Obersteiner. 2008. “Natural Disasters as Creative Destruction? Evidence from Developing Countries.” Economic Inquiry, 46 (2), 214−26.
International Institute of Social Studies. Indices of Social Development. http://www.IndSocDev.org/
Skidmore, M. and H. Toya. 2002. “Do Natural Disasters Promote Long-run Growth?” Economic Inquiry, 40, 664–87.
Toya, Hideki. 2014. “Shizen saigai no makuro keizai e no chōkiteki inpakuto nit suite” (On the Long-Term Macroeconomic Impact of Natural Disasters). Chap. 3 in Kyodai saigai risuku to keizai (Risks and Economic Repercussions of Catastrophes), ed. Sawada Yasuyuki, 79–102 (Nikkei Publishing, 2014).
Toya, H., and M. Skidmore. 2012. “Do Natural Disasters Enhance Societal Trust?” CESifo Working Paper Series 3905, CESifo Group Munich.
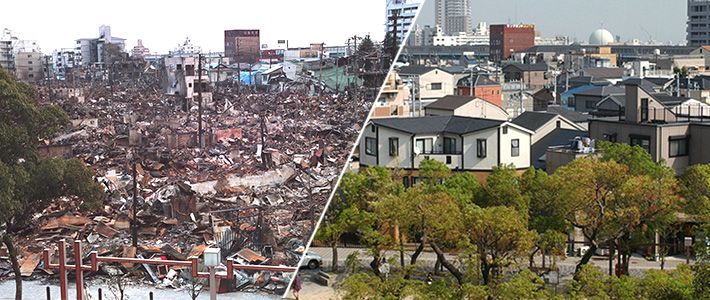
(Banner photo: Kobe’s Nagata-ku shortly after the 1995 earthquake, on the left, and in 2004 . © Jiji)
(*1) ^ Per capita GDP indicates a nation’s level of economic prosperity and development and is widely regarded as the most important index of macroeconomic performance owing to its close links with other macroeconomic indicators.
(*2) ^ With regard to the recovery and reconstruction phases following the Great Hanshin-Awaji Earthquake, see, for example, the following: https://web.pref.hyogo.lg.jp/wd33/documents/hanshin_awaji_fukkyufukkou_140124_.pdf.
(*3) ^ α and β are, as functions of production, both positive figures that can normally be expressed as α + β < 1.
(*4) ^ Using data from 90 countries between 1960 and 1990, Skidmore and Toya (2002) point to a positive correlation between the frequency of climatic disasters that can more or less be predicted using today’s technology ( such as extreme winds and floods) and per capita GDP growth. The article also notes that the correlation is a factor related to increases in total factor productivity (rate of technological progress) and to higher rates of per capita human capital accumulation.
(*5) ^ An additional factor that has attracted attention is “quality of government.” For an analysis of how a natural disaster can raise the quality of government services and encourage economic growth, see, for example, Toya 2014.
(*6) ^ Namely, civic activism, clubs and associations, intergroup cohesion, interpersonal safety and trust, gender equality, and inclusion of minorities: http://www.indsocdev.org.
Great Hanshin-Awaji Earthquake global warming abnormal weather natural disasters macroeconomy productivity