Thinking About the Yen’s True Strength
Economy- English
- 日本語
- 简体字
- 繁體字
- Français
- Español
- العربية
- Русский
Predicting the Rate Is Impossible
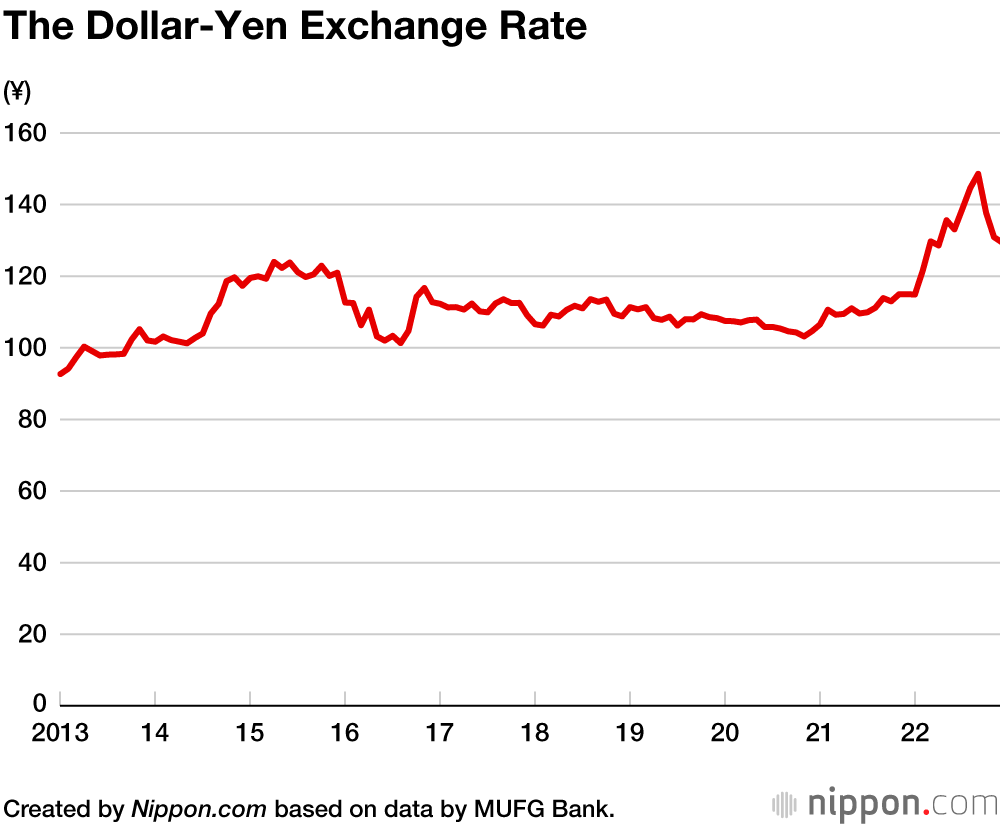
The rate of exchange is usually discussed in terms of the dollar-yen exchange rate. This rate shifted dramatically in 2022.
For nearly 10 years from 2013 to 2021, the dollar-yen rate trended mostly around the 110 level, and people came to believe that the rate of exchange was more or less stable.
This situation, however, changed dramatically when inflation accelerated in the United States in 2021. The dollar interest rate began to rise, and the spread in interest rates between Japan and the United States began to widen. This caused the dollar-yen rate to depreciate suddenly. An exchange rate that was around ¥113 to the dollar in January 2022 breached ¥150 in October.
During this period, the spread in interest rates between the dollar and the yen became the focus of market participants. With few indications that inflation would quickly subside, the interest rate rose rapidly in the United States. The Bank of Japan, however, held fast and sought to maintain the upper limit of the long-term rate (the yield on 10-year Japanese government bonds) at 0.25%. As a result, the spread in interest rates between the dollar and yen, which was around 1 percentage point at the start of 2021, widened to nearly 4 points in October 2022, when the yen fell to its lowest level.
In November, the dollar-yen exchange rate rate turned, and the yen began to strengthen again. As I write this article at the start of 2023, the yen is showing signs of returning to the 120–130 level against the dollar.
Two factors are closely related to the movements of the dollar-yen rate in October and November. The first factor is the downtrend of the interest rate in the United States. Based on the assumption that inflation has peaked, the long-term interest rate has begun to fall in the United States. The second factor is the uptrend of the yen interest rate. When the Bank of Japan announced in December 2022 that it would raise the upper limit of the trading range for the long-term rate from 0.25% to 0.5%, market participants strengthened their expectations that Japan’s interest rate would begin to rise. Based on the assumption that the spread in interest rates between the dollar and the yen would narrow, the yen changed course and began to strengthen.
Going forward, which direction is the dollar-yen rate likely to head? According to the efficient market hypothesis (which holds that market prices fully reflect all usable information), the direction of foreign exchange rates is impossible to predict.
Based on this hypothesis, the direction of the dollar-yen rate is unknown. However, whichever direction it heads, the moves it will make may potentially be large. This is likely the sentiment of the market.
Understanding the Dollar-Yen Rate in Terms of the Real Effective Exchange Rate
While the dollar-yen rate is an easily understood indicator, it does not accurately represent the actual strength (purchasing power) of the yen. There are two reasons for this.
First, the greenback is not the only currency in circulation. There are many other currencies, such as the euro, the Chinese yuan, the South Korean won, the British pound, and the Australian dollar. Each of these currencies has an exchange rate with the Japanese yen. To decide whether the yen will be strengthening or weakening, it is necessary to examine its relationship with all these currencies. The (nominal) effective exchange rate is a rate for determining whether the yen is strengthening or weakening against a weighted average of these currencies.
Let us examine the example of the dollar-yen rate’s rise from the 110 level to 150 in 2022. Indeed, the yen did depreciate sharply against the dollar during this period. However, many other currencies also depreciated against the dollar. In other words, this was a period when the dollar strengthened across the board. To understand how far the yen weakened, we must examine its exchange rate with these other currencies as well. Doing so, we see that the yen did not weaken as far as the dollar-yen rate did.
The prominence given the dollar-yen rate is explained by the dollar’s historical importance as a currency. From the end of World War II to 1971, the exchange rates of many currencies were fixed against the US dollar. In the case of the yen, its exchange rate was fixed at 360 to the dollar. For this reason, to understand the value of the yen, it was sufficient to examine the dollar-yen rate. However, under a floating-rate regime where currencies move independently, the effective exchange rate became more important than the dollar-yen rate.
Another factor must be considered to understand the value of a currency. This is the fact that the true value of a currency cannot be measured with the nominal exchange rate. For example, to determine the value or strength of the yen as a currency, the amount of goods it can purchase becomes important.
This situation is readily understood by examining the movement of the yen over the last 20 years when deflationary conditions persisted in Japan. Comparing the dollar-yen rate between 2000 and 2020, we see that it was largely unchanged at around ¥107 to the dollar. However, the trend for prices and wages between 2000 and 2020 paints a very different picture. While prices and wages have barely changed in Japan, they have risen by about 2% per year in the United States, or by about 48% during this 20-year period.
In other words, even though the dollar-yen rate barely changed over a period of 20 years, prices and wages in Japan fell by nearly 50% compared to the United States. We can therefore conclude that the value and strength of the yen has diminished by nearly 50% in relative terms.
The indicator for viewing the yen’s strength in this manner is the real effective exchange rate. This is the effective value of the dollar-yen rate that factors the movement of prices into the rate’s movement. More specifically, the increase of prices in Japan is recorded as the appreciation of the yen, and the increase of prices in the United States is recorded as the depreciation of the yen. Since prices rose by a considerable margin between 2000 and 2020 in the United States, the real effective dollar-yen rate has depreciated by a considerable margin compared to the nominal exchange rate (usually that determined by the market).
The exchange rate that combines the effective exchange rate and the real exchange rate, the former representing the average exchange rate with multiple currencies and the latter factoring in the movement of prices, is the real effective exchange rate. This is the measure that expresses the true strength, or value, of the yen.
The Structural Weakness of the Yen
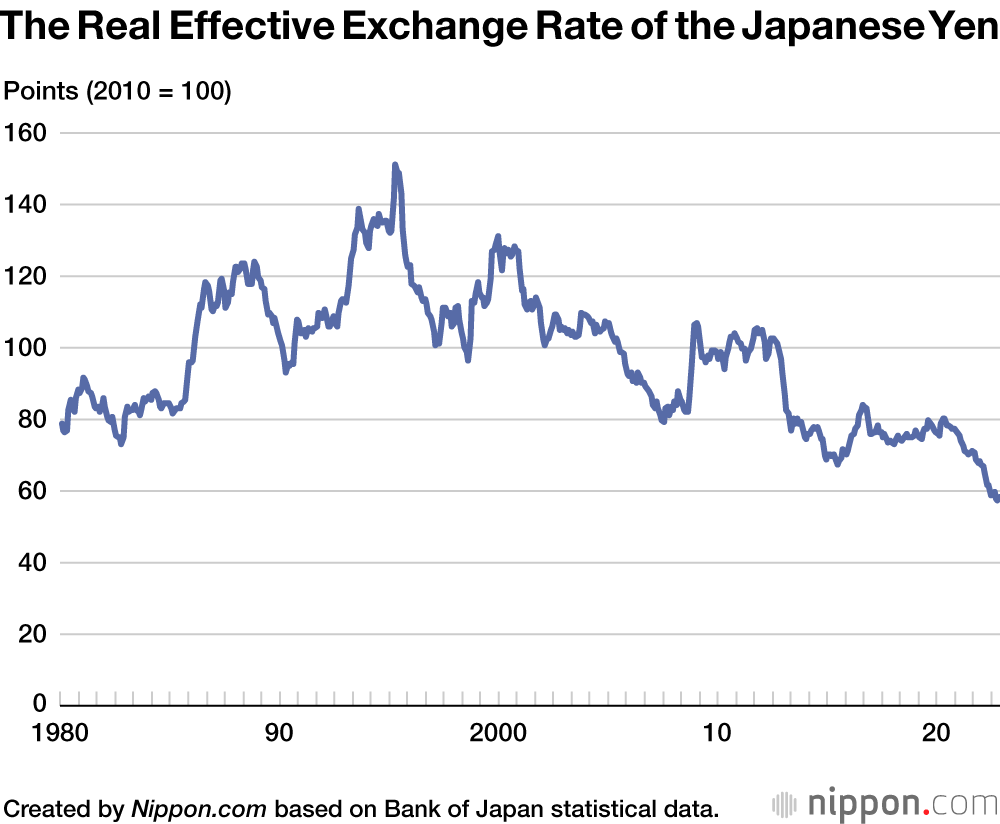
The above graph depicts the real effective exchange rate of the yen from 1980 to the present. It shows the strength (or weakness) of the yen indexed to a base year.
In the graph, 2010 is set to 100 as the base year, to which the exchange rates of other years are compared. For example, the exchange rate of October 2022 is 57.26, indicating that the strength of the yen has declined by more than 40%. While this is certainly the consequence of the sharp depreciation of the dollar-yen rate (nominal rate) during the 12 months of 2022, that is not the only factor.
Before the yen depreciated sharply in August 2021, it traded at ¥110 to the dollar. The yen’s real effective exchange rate, however, was 71.09 at this time, indicating considerable weakness (30% less than the base year of 2010). Accordingly, even if the dollar-yen rate returns to 110, the yen’s weakness will remain unchanged.
The real effective exchange rate representing the true strength of the yen therefore reflects both short-term fluctuations and medium- to long-term structural changes. Changes to the real yen rate may reflect the movement of prices and wages while the nominal rate remains unchanged, or may reflect changes to the nominal rate while prices and wages are unchanged.
Taking a longer view of the real effective exchange rate, we see that the yen’s appreciation peaked in 1995, after which it depreciated. The year 1995 falls slightly after the collapse of an asset bubble, and is the moment when Japan’s economy was at a peak. The strength of the yen also peaked at this time, after which it has continued to weaken. This trend is not the consequence of the short-term fluctuations of the macro economy but is the result of structural changes.
While the claim is often made that a weak yen weakens Japan’s economy, this is not correct. The root cause of the weak yen is the major structural changes besetting Japanese society, such as to the industrial structure. These changes are also manifest in the movements of the real effective exchange rate. Thus, altering the exchange rate (even if that were possible) would not turn Japan’s economy in a positive direction.
The real effective exchange rate is currently at its lowest level since 1980, the extent of the period shown in the graph. This is also the case for August 2021, when the rate was ¥110 to the dollar. In other words, regardless of the recent rapid movements of the dollar-yen rate, the yen’s strength in structural terms is at an extremely low level.
The real effective exchange rate expresses both the structural changes discussed above and short-term fluctuations stemming from the movements of the macro economy as seen in 2022. Of these changes, those of a structural nature have greater significance than short-term fluctuations.
The yen’s extreme weakness is closely related to the deflationary trend that has burdened Japan’s economy. Considering how this situation can be corrected holds the key to solving the problem of an extremely weak yen. Increasing investment in the domestic economy and promoting innovation will be important issues, a subject that exceeds the scope of this article.
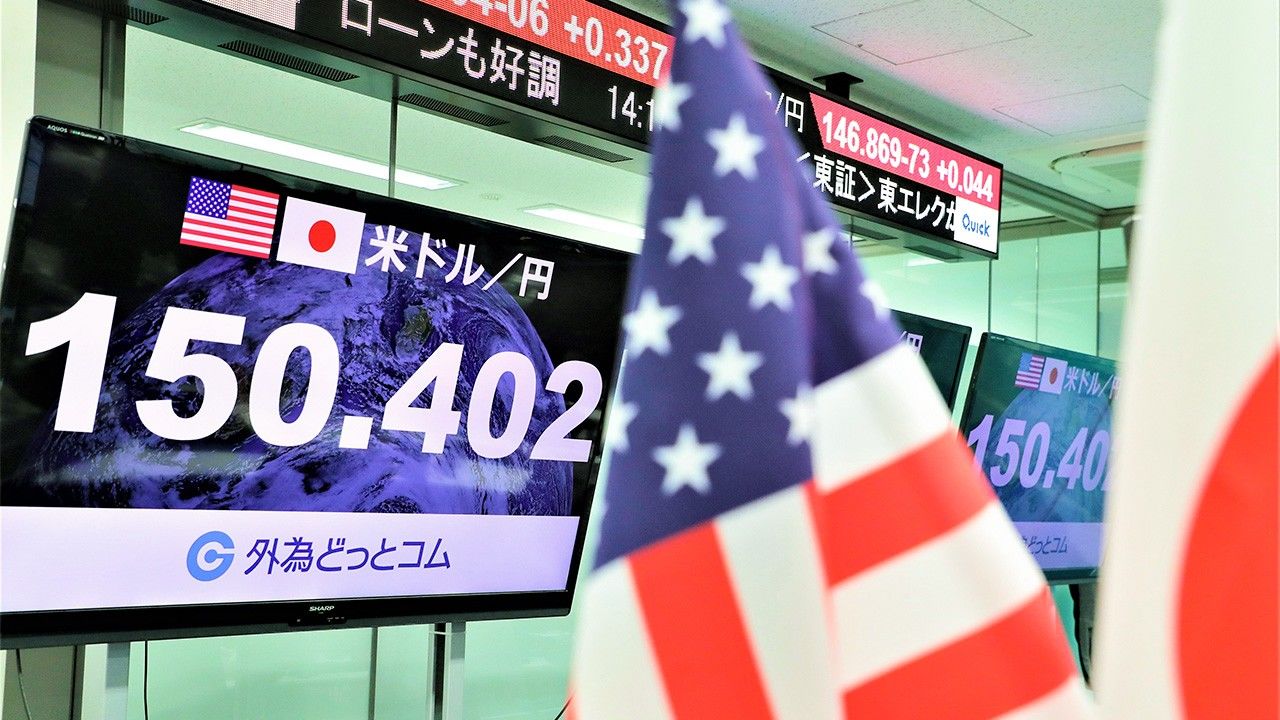
(Originally published in Japanese. Banner photo: A monitor showing the yen having fallen to the level of ¥150 to the US dollar on October 21, 2022, at the Gaitame.com office in Minato, Tokyo. © Jiji.)