Japanese Container Port Traffic Falls Behind Rest of Asia
Economy- English
- 日本語
- 简体字
- 繁體字
- Français
- Español
- العربية
- Русский
In 2018, most of the world’s top 10 container shipping ports were in China, while Japan’s busiest port, the Port of Tokyo, ranked a mere 35th place. This state of affairs is a stark contrast with 40 years ago when the Port of Kobe was the world’s fourth busiest. As the presence of the rest of Asia has grown, Japan has fallen down the ranking table.
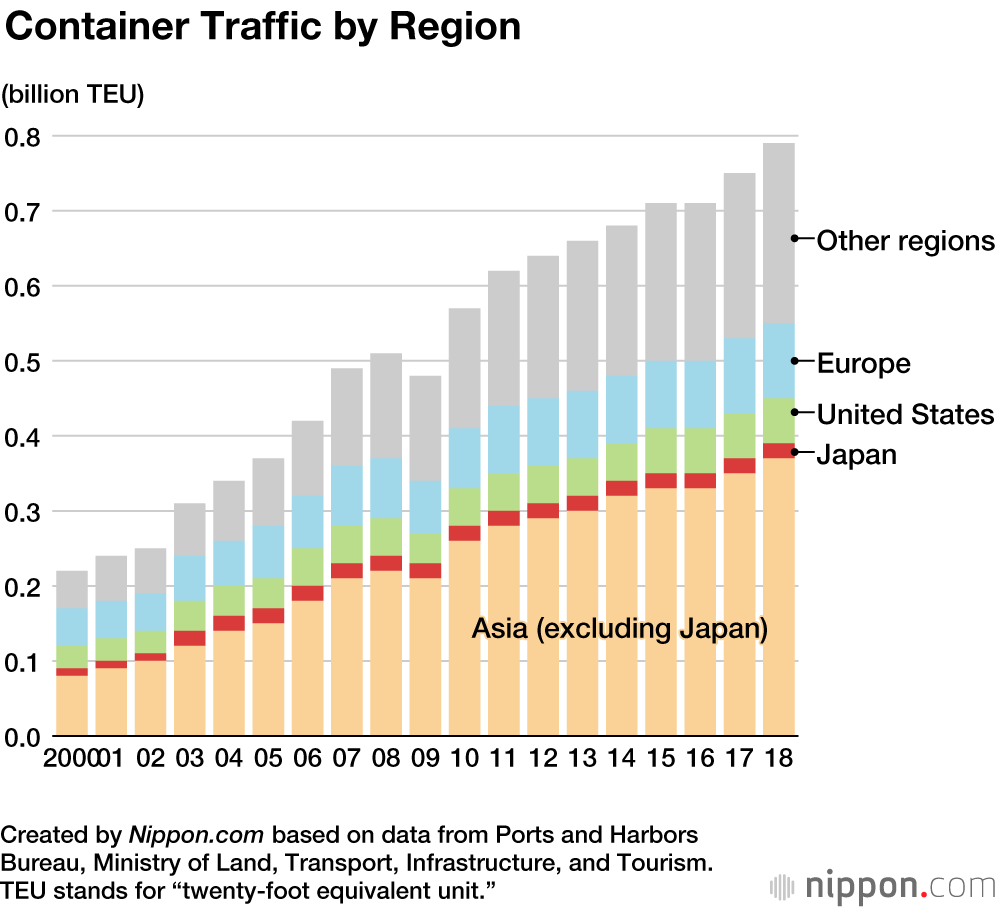
In 2008, some 516 million twenty-foot equivalent units passed through the world’s container ports (TEU is the standard international unit for measuring container traffic). By 2020, this figure had reached 793 million TEU—an increase of 50% in just over a decade. The rise was driven by other Asian nations, whose traffic has increased 60% over the period. Meanwhile, traffic at Japanese ports remains flat, causing Japan’s rank to fall relative to those of other nations.
Top Container Ports (2018)
| Port | Traffic (million TEU) | |
|---|---|---|
| 1 | Shanghai, China | 42.0 |
| 2 | Singapore | 36.6 |
| 3 | Ningbo, China | 26.4 |
| 4 | Shenzhen, China | 25.7 |
| 5 | Guangzhou, China | 21.9 |
| 6 | Busan, South Korea | 21.7 |
| 7 | Hong Kong | 19.6 |
| 8 | Qingdao, China | 19.3 |
| 9 | Tianjin, China | 16.0 |
| 10 | Dubai, United Arab Emirates | 15.0 |
| 35 | Tokyo | 4.6 |
Created by Nippon.com based on data from Lloyds’s List One Hundred Ports 2019 and Japan Maritime Public Relations Center.
Top Container Ports (2001)
| 1 | Hong Kong | 18.0 |
| 2 | Singapore | 15.5 |
| 3 | Pusan, South Korea | 7.9 |
| 4 | Kaohsiung, Taiwan | 7.5 |
| 5 | Shanghai, China | 6.3 |
| 6 | Rotterdam, the Netherlands | 5.9 |
| 7 | Los Angeles, United States | 5.2 |
| 8 | Shenzhen, China | 5.1 |
| 9 | Hamburg, Germany | 4.7 |
| 10 | Long Beach, USA | 4.5 |
| 18 | Tokyo | 2.8 |
| 21 | Yokohama | 2.4 |
| 25 | Kobe | 2.1 |
Created by Nippon.com based on data from Lloyds’s List One Hundred Ports 2019 and Japan Maritime Public Relations Center.
Top Container Ports (1980)
| 1 | New York/New Jersey, United States | 1.95 |
| 2 | Rotterdam, the Netherlands | 1.90 |
| 3 | Hong Kong | 1.47 |
| 4 | Kobe | 1.46 |
| 5 | Kaohsiung, Taiwan | 0.98 |
| 6 | Singapore | 0.92 |
| 7 | San Juan, United States | 0.85 |
| 8 | Long Beach, United States | 0.83 |
| 9 | Hamburg, Germany | 0.78 |
| 10 | Oakland, United States | 0.78 |
| 12 | Yokohama | 0.72 |
| 18 | Tokyo | 0.63 |
Created by Nippon.com based on data from Lloyds’s List One Hundred Ports 2019 and Japan Maritime Public Relations Center.
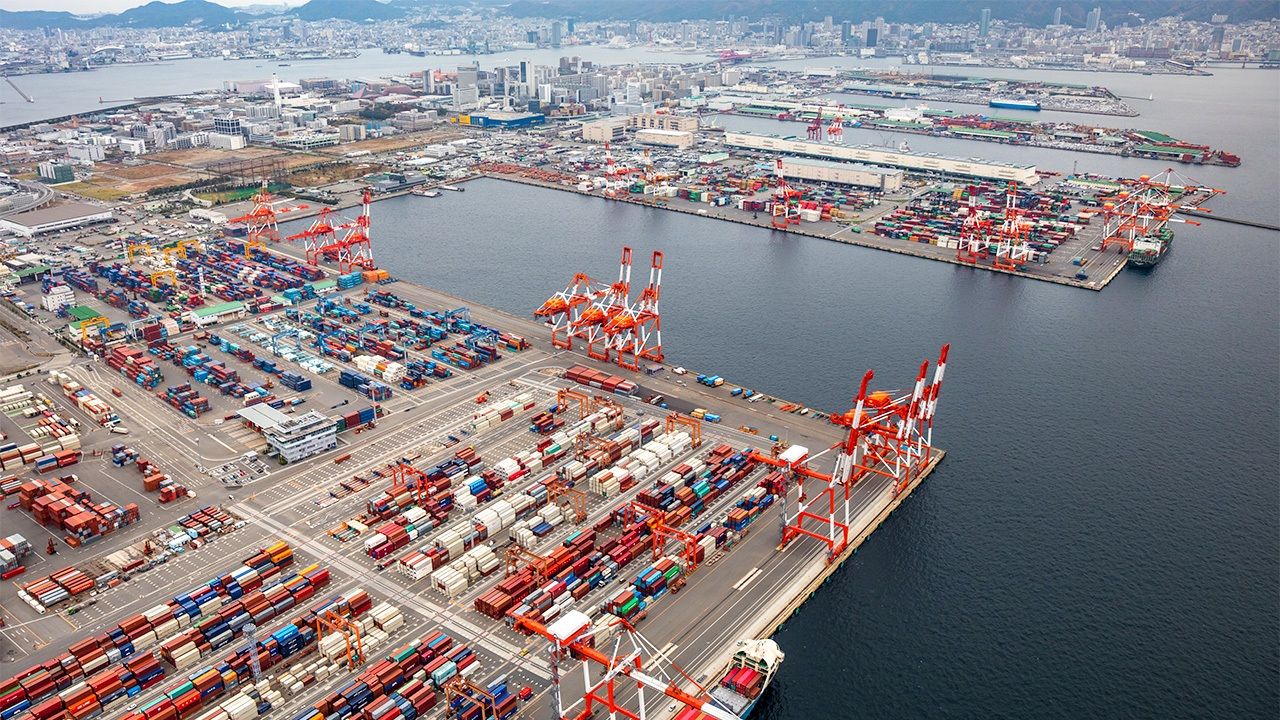
(Translated from Japanese. Banner photo: Port of Kobe. © Pixta.)