Value of Japan’s Agricultural Output Increases by 5.5%
Economy Food and Drink- English
- 日本語
- 简体字
- 繁體字
- Français
- Español
- العربية
- Русский
Surging Imports
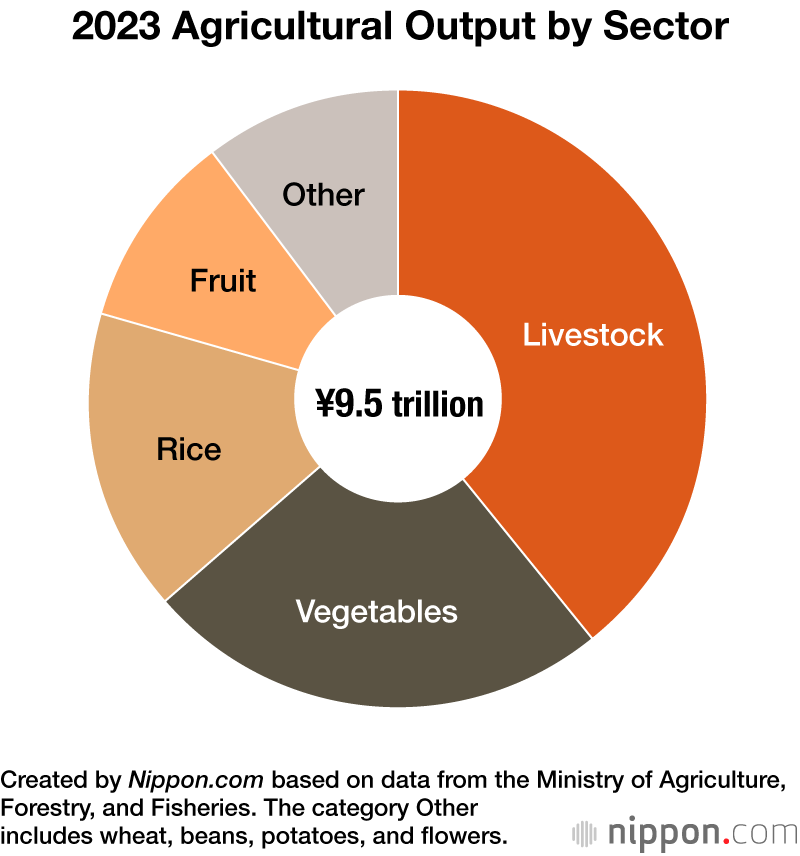
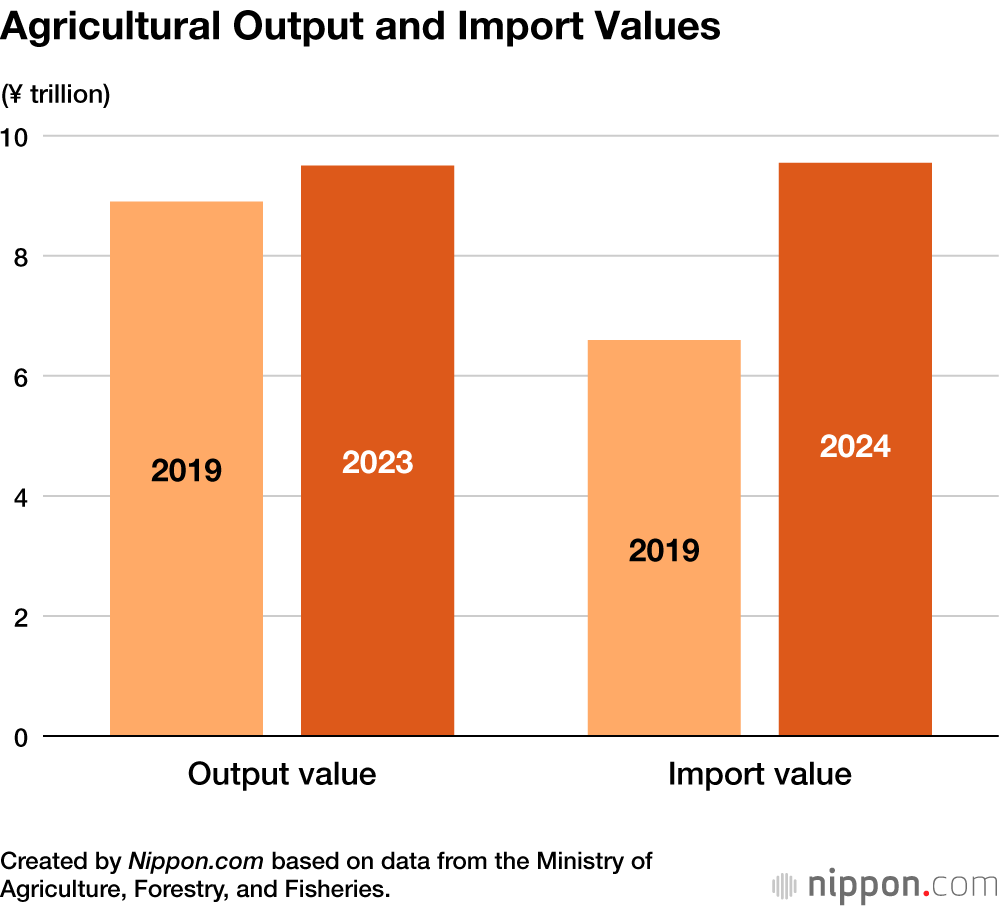
Japan’s total agricultural output in 2023 increased on a value basis by 5.5% over the previous year, to ¥9.5 trillion, according to a 2024 white paper published by the Ministry of Agriculture, Forestry, and Fisheries. The increase was mainly due to rising prices of rice, vegetables, and eggs.
Livestock was the largest sector, at ¥3.7 trillion or 39.2% of all output, followed by vegetables at ¥2.3 trillion (24.5%), rice at ¥1.5 trillion (16.0%), and fruit at ¥1.0 trillion (10.1%). The value of rice rose by 8.9% year on year due to strong demand for the 2023 rice crop, which led to falling private inventories and rising market prices.
Data on agricultural output by prefecture shows that Hokkaidō ranks first, at ¥1.3 trillion, followed by Kagoshima at ¥540 billion, Ibaraki at ¥460 billion, Chiba at ¥400 billion, and Kumamoto at ¥380 billion.
The value of imported agricultural and livestock products also surged in 2024. Total imports rose by 5.4% that year, to ¥9.5 trillion, or just slightly over the value of agricultural output in 2023. The United States was the top exporter to Japan, followed by China, Australia, Thailand, Canada, and Brazil. In total, these six countries accounted for 60% of all Japan’s agricultural imports. For wheat in particular, it relies almost entirely on Australia, Canada, and the United States for its imports.
Domestic Rice Production Up
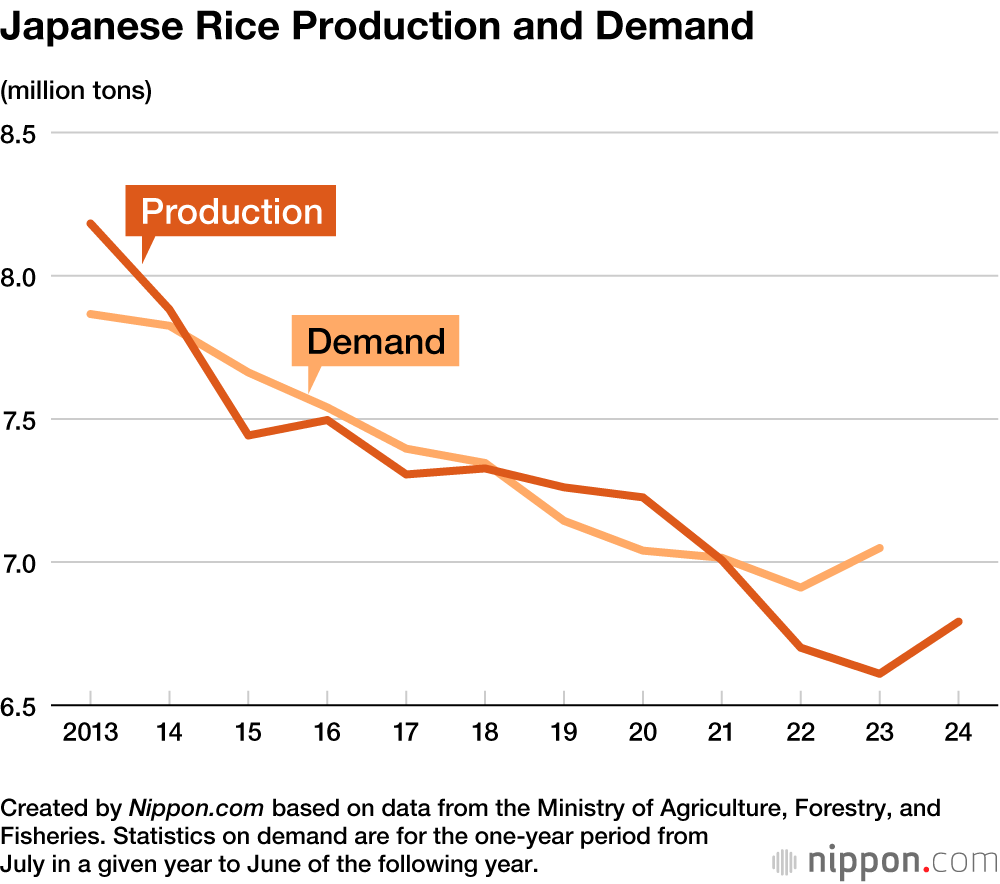
In 2024, production of Japan’s staple crop rice increased year on year by 2.8%, to 6.8 million tons. The increase was due to a combination of factors, including the shift from rice grown for animal feed to rice intended for human consumption, especially in the northern and eastern regions of the country, and generally favorable weather conditions nationwide. In both 2022 and 2023, rice production fell short of demand, thereby contributing to a major increase in prices.
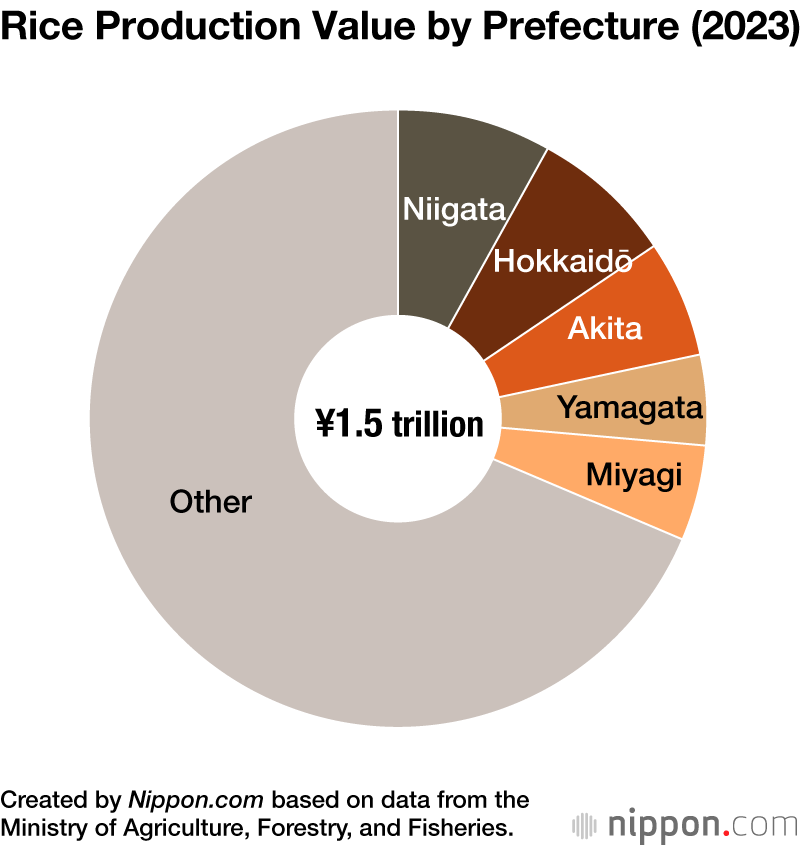
Statistics on rice production by prefecture shows that Niigata was top, accounting for 8.2% of the annual production value, followed by Hokkaidō (7.5%), Akita (6.1%), Yamagata (4.8%), and Miyagi (4.8%). The other 42 prefectures accounted for the remaining 68.6%.
Data Source
- Annual Report on Food, Agriculture, and Rural Areas in Japan FY2024 (Japanese) from the Ministry of Agriculture, Forestry, and Fisheries.
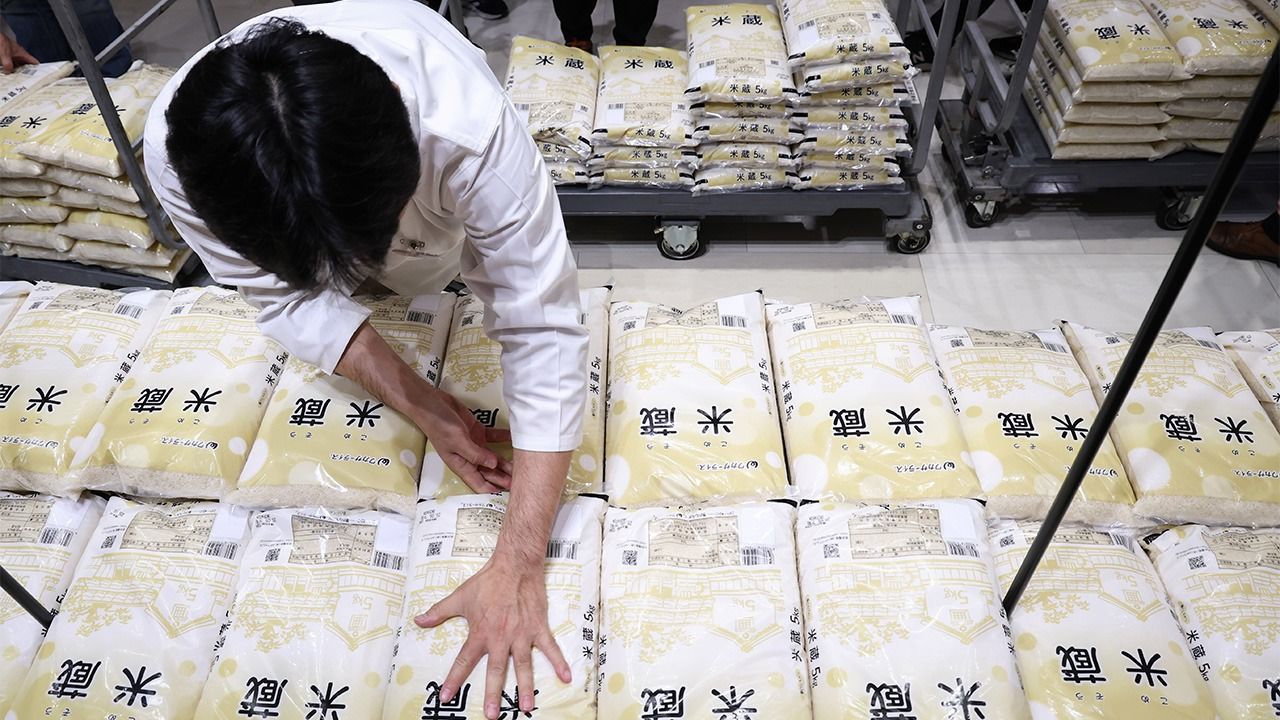
(Translated from Japanese. Banner photo: Rice from government stockpiles on sale at a Tokyo supermarket. © Jiji.)