
What Will Happen with Pension Uncertainties in Japan?
Society Economy- English
- 日本語
- 简体字
- 繁體字
- Français
- Español
- العربية
- Русский
Pensioners Draw Down Their Savings
How much will people need to depend on their savings once they retire in Japan? To answer this question, I will assume a household consisting of a married couple whose main source of income is the public pension. I will use statistics from the 2014 National Survey of Family Income and Expenditure of the Ministry of Internal Affairs and Communications (the most recent survey that is published every five years). The age group data for unemployed households aged 65 years or older (pensioner households) presented in this survey is more detailed than in the ministry’s Report on the Family Income and Expenditure Survey.
In this survey, two-or-more person households with a household head between the ages of 65 and 69 recorded an average monthly deficit of ¥60,276 in household income and expenditures (Figure 1). Over a period of five years, this deficit would total ¥3.62 million. The savings of this age group averaged ¥22.54 million, which likely consists mostly of a retirement allowance. For two-or-more person households with a household head between the ages of 70 and 74, the average savings balance declined ¥2.58 million to ¥19.94 million, indicating a significant drawing down of savings.
Figure 1: Household Income and Expenditures of Unemployed Households (¥/Month)
| Age of head of household | |||||
|---|---|---|---|---|---|
| 65–69 | 70–74 | 75-79 | 80–84 | 85– | |
| Disposable income | 210,631 | 207,918 | 205,244 | 212,291 | 220,730 |
| Consumption, other expenditures | 270,907 | 250,791 | 222,279 | 218,826 | 211,400 |
| Monthly balance | –60,276 | –42,873 | –17,035 | –6,535 | 9,330 |
| Savings balance (million ¥) | 22.54 | 19.94 | 18.12 | 21.72 | 21.09 |
Source: Ministry of Internal Affairs and Communications, 2014 National Survey of Family Income and Expenditure. Data for two-or-more person households.
The Effect of Economizing
Particularly worth noting is that the average monthly deficit declined for older age groups, turning into a monthly surplus of ¥9,330 for households 85 years or older. As a result, the savings balance turned to increase after bottoming out for households aged 75–79.
This data indicates that the monthly budget deficits of households aged 65–69 (¥60,276 monthly, ¥723,312 yearly) do not last for 30 years. Should such a deficit actually continue for 30 years, the cumulative shortfall would total ¥21.7 million. Elderly couples are not recording such deficits. They are reducing expenditures as they grow older so they no longer need to draw down their savings so much once they reach the age of 85 years or older. The income and expenditures of single-person households aged 65 or older (Figure 2) do not become a surplus for households aged 80 years or older, but the deficit does decline with the increase in age.
Figure 2: Household Income and Expenditures of Unemployed Single-Person Households (¥/Month)
| Age of head of household | ||||
|---|---|---|---|---|
| 65–69 | 70–74 | 75-79 | 80– | |
| Disposable income | 105,822 | 115,291 | 123,482 | 135,255 |
| Consumption, other expenditures | 165,543 | 150,918 | 143,980 | 150,065 |
| Monthly balance | –59,721 | –35,627 | –20,498 | –14,810 |
| Savings balance (million ¥) | 15.22 | 12.91 | 13.88 | 15.09 |
Source: Ministry of Internal Affairs and Communications, 2014 National Survey of Family Income and Expenditure Average for men and women
When we examine what items elderly pensioner households are economizing on to reduce their budget deficit, we find that they are mainly cutting back on clothes and footwear, private transportation, and travel and other recreational services. It is easy to imagine that economizing on food is difficult to do.
As a result, the savings balance averaged ¥21.09 million for two-or-more person households in the 85-or-older age group and averaged ¥15.09 million for single-person households in the 80-or-older age group (¥16.52 million for men and ¥14.43 million for women). Naturally, even if people have a savings balance of ¥15.0 million to ¥20.0 million when they reach the age of 80, not all of this amount can be used for living expenses. Funds will be needed for medical and nursing care expenses and for the cost of home repair or remodeling. It is possible to say that households will need to set aside ¥7.6 million by the time they begin to receive pension benefits (capital gains are not considered) to prepare for household budget deficits from age 65 to 84.
An Effective 20% Pension Reduction
The above discussion is based on the latest available statistics. If the current public pension is reduced in future years, the figures used above will change. In other words, future pension adjustments will increase the amount of funds that will need to be set aside for old age.
The income substitution rate indicates the pension a retiree receives as a percentage of the income of the working age population. In the previous verification of pension finances (2014), the income substitution rate of pensioner households (employees’ pension and basic pension) was 62.7% of working-age males’ average take-home pay, set at ¥348,000. The government plans to lower this percentage in stages to around 50%. Such a change would cause the income of pensioner households to decrease by about 20%, from ¥218,000 in 2014 to ¥174,000 in the future.
The government maintains that pension benefits will need to be slashed by such an amount to restore the stability of employees’ pension finances. Since reducing annual benefit payments by 1% is thought to increase the household budget deficit throughout retirement by about ¥500,000, reducing the pension by 20% would expand the deficit by around ¥10.0 million, and the amount needed to be set aside for old age would rise.
Some adjustment of the pension will be indispensable. Japan’s elderly ratio (the percentage of people aged 65 or older in the total population) is the highest in the world at 27%. This ratio is expected to climb to 38% by around 2050, making the current pension system unsustainable. Thus, the task at hand is to determine what kinds of reforms are needed, rather than preserving the system as it is. Reforms instituted in 2004 included the adjustment of pension benefits according to certain macroeconomic factors. Based on this rule, the effective annual adjustment of the pension is determined by the increase of life expectancy, a factor for higher expenditures, and the decrease of pension participants (insured persons), a factor for lower revenues. With life expectancy increasing 0.3% and pension participants decreasing 0.6% in fiscal 2015, the pension was adjusted downward by 0.9%. Even so, adjustments are being made at a considerably slower pace than the actual situation.
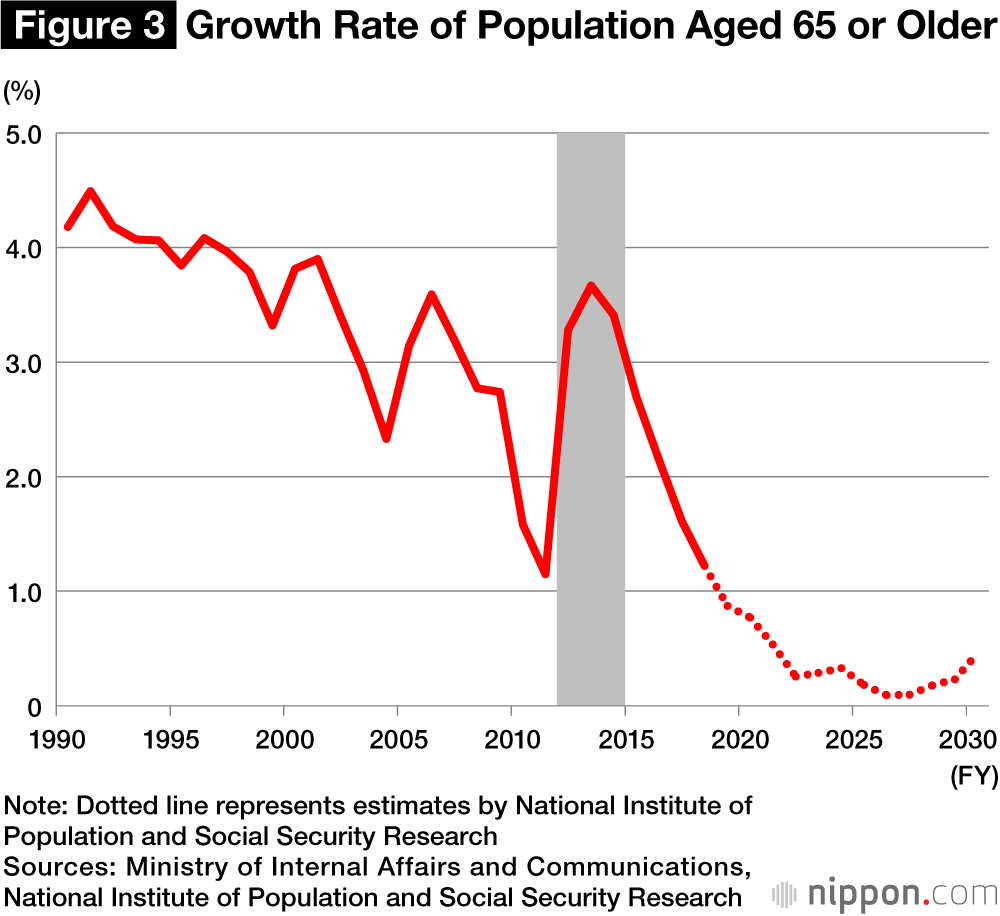
The number of people aged 65 years or older is expected grow more slowly, with the annual growth rate falling below 1% (Figure 3). However, the number of working-age people aged 15–64 will decline at an annual rate of 0.5% to 1.7%, reducing the number of contributors to pension schemes.
Some possible responses to these factors are to boost the number of pension contributors by increasing the employment rate of women and the elderly and to expand the group that can become participants in the employees’ pension. Should such steps be taken, enabling regular employees to continue working and to maintain their careers will have an enormous effect in increasing pension premium revenues. Another key step will be to raise per capita wages (productivity).
What Must We Do?
If pension benefits are adjusted downward by around 20%, the budget deficits of elderly households will increase by more than currently expected. And if the monthly deficit of households aged 65–69 increases, they will need to work to earn an income during that period. To prepare for such a risk, people will need to plan for the second half of their lives while still young. Possible approaches to take are discussing matters with a financial planner and becoming familiar with economizing and with keeping a household budget. Improving such skills will be more important than studying how to make money.
A growing number of salaried workers are continuing to work until age 64 rather than retiring at 60. For most workers, though, the level of salary income will fall sharply after they reach 60. To avoid such a situation from happening, people will need to plan their careers for the second half of their lives while in their forties and fifties, taking preparatory steps and making career choices so that salary income need not decline.
There are, however, many people who will find it difficult to flexibly design their careers. These people include the “lost generation,” who joined the work force during the so-called employment ice age lasting from the mid-1990s through much of the first decade of the current century, when stable, full-time positions were harder to come by. They will not find it easy to live off of the national pension alone from the age of 65 after years of working in nonregular employee positions. What kind of life is possible with the current monthly pension benefit of ¥65,000? What if such people do not own their home, if they live in the greater Tokyo region with its high prices, or if they need to care for their even more elderly parents? When such people run into various limitations, they will experience considerable difficulties in their old age.
(Originally published in Japanese. Banner photo © Pixta.)