
Record 1.66 Million Foreign Workers in Japan in 2019
Society- English
- 日本語
- 简体字
- 繁體字
- Français
- Español
- العربية
- Русский
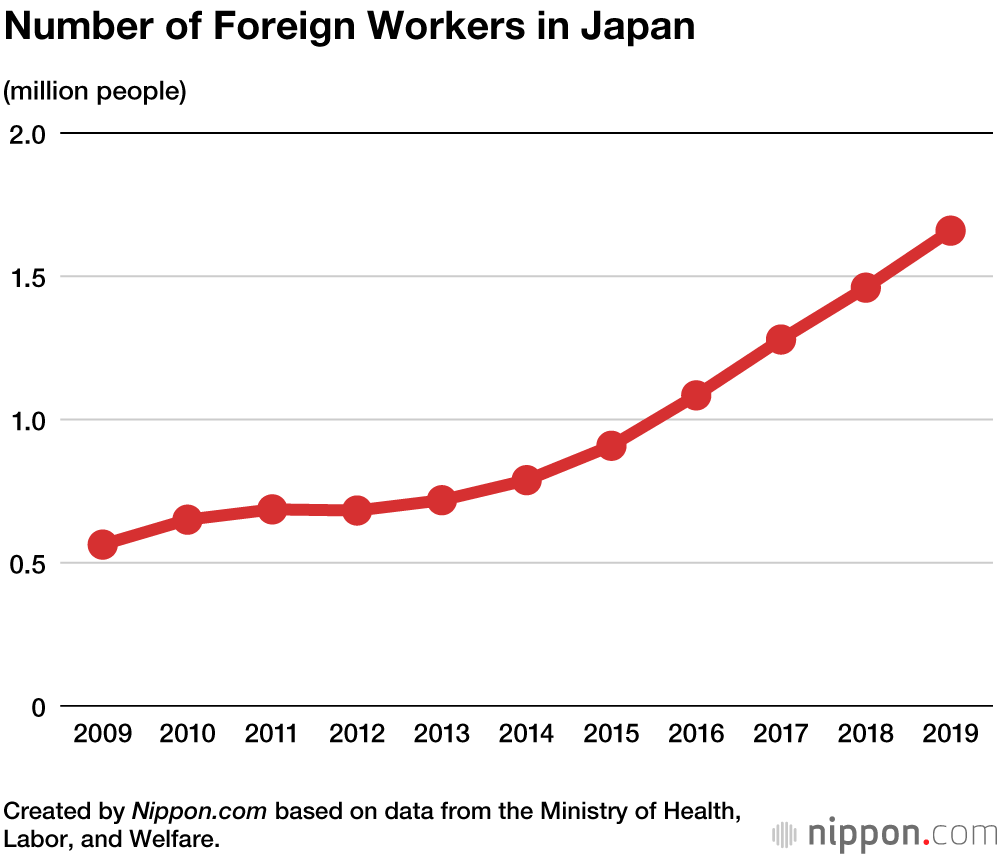
There were 1,658,804 foreign workers in Japan in October 2019. The Ministry of Health, Labor, and Welfare announced that there had been a 13.6% increase in non-Japanese workers from 2018, as the total hit a new high for the seventh consecutive year. The top two countries, China and Vietnam, accounted for more than 800,000 people.
By nationality, the largest groups were Chinese with 418,327 workers (25.2%) and Vietnamese with 401,326 (24.2%). This was followed by 179,685 Philippine workers (10.8%), and 135,455 Brazilians (8.2%). Compared to 2018, the highest increases were seen with Vietnamese workers (a rise of 26.7%), Indonesians (up 23.4%), and Nepalese (up 12.5%).
Foreign Workers by Nationality
| China (includes Hong Kong) | 418,327 |
| Vietnam | 401,326 |
| Philippines | 179,685 |
| Brazil | 135,455 |
| Nepal | 91,770 |
| South Korea | 69,191 |
| Indonesia | 51,337 |
| Peru | 29,554 |
Created by Nippon.com based on data as of October 2019 from the Ministry of Health, Labor, and Welfare.
By residence status, the largest group with 32.1% were those who had residence based on their situation, including permanent residents and spouses of Japanese citizens. A further 23.1% were technical interns, 22.5% were those holding permission to engage in activities outside of their visa status, such as exchange students, and 19.8% were people in specialist and technical fields, including artists, those engaged in religious activities, journalists, researchers, and qualified experts. A new status category for workers with “specified skills” was established in April 2019 and as of the end of October 520 people were registered under this status.
By industry, the highest number of non-Japanese workers with 483,278 (29.1%) were engaged in manufacturing. Other industries with large numbers included wholesale and retail with 12.8% and accommodation and food service with 12.5%.
Foreign Workers by Industry
| (%) | ||
|---|---|---|
| Manufacturing | 483,278 | 29.1 |
| Wholesale/retail | 212,528 | 12.8 |
| Accommodation/food and drink service | 206,544 | 12.5 |
| Construction | 93,214 | 5.6 |
| Education/learning support | 70,941 | 4.3 |
| Information and communications | 67,540 | 4.1 |
| Health Care/welfare | 34,261 | 2.1 |
| Service (excluding other categories) | 266,503 | 16.1 |
| Other | 223,995 | 13.5 |
Created by Nippon.com based on data as of October 2019 from the Ministry of Health, Labor, and Welfare.
A 12.1% year-on-year increase led to a new record high of 242,608 companies employing foreign workers. A total of 587,435 (35.4%) were engaged at small businesses that had fewer than 30 employees. A further 375,423 (22.6%) worked at businesses with between 100 to 499 employees, 320,812 (19.3%) were engaged at places with more than 500 employees, and 306,567 (18.5%) at places with between 30 to 99 employees.
(Translated from Japanese. Banner photo © Fast&Slow/Pixta.)