
Osaka and Nara Top for Corporate Entertainment Expenses in Post-Pandemic Era
Economy Society- English
- 日本語
- 简体字
- 繁體字
- Français
- Español
- العربية
- Русский
With the COVID-19 pandemic having subsided, social exchange activities, such as entertaining business partners and meetings with companies in the same industries to share information, are on the rise once more.
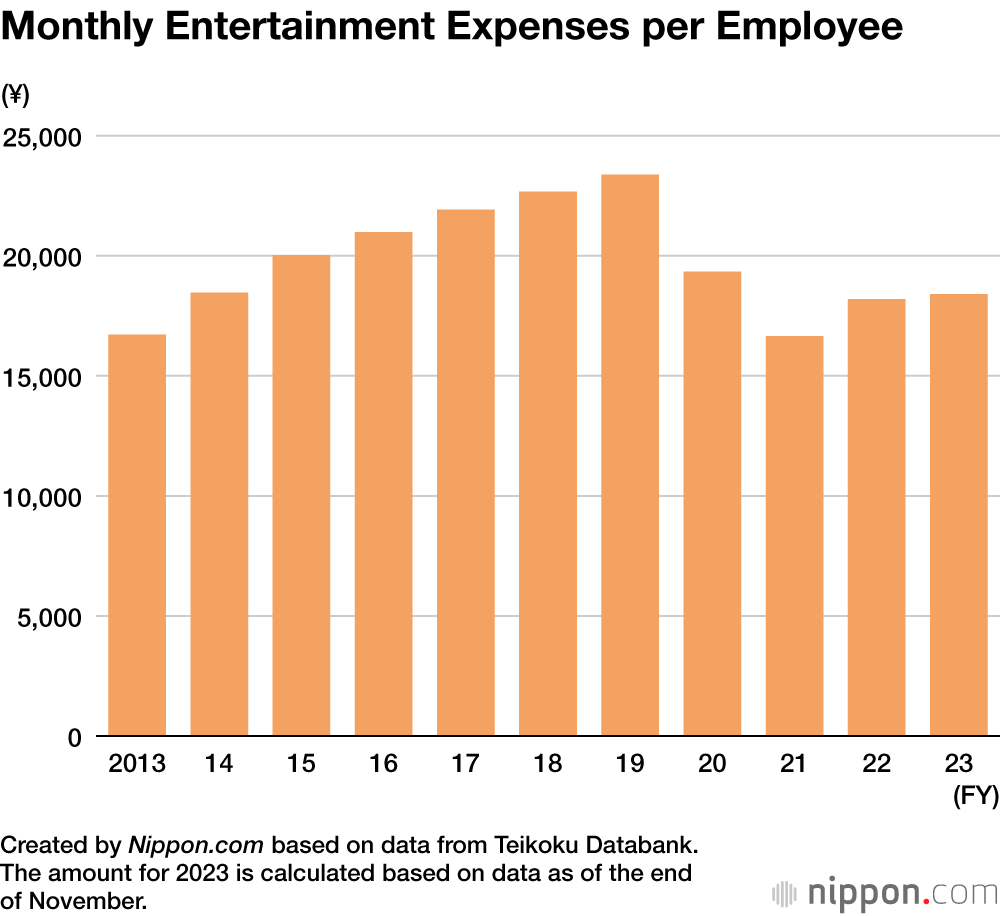
Looking at fiscal 2022 financial statements, Teikoku Databank estimated that the publicly declared entertainment expenses of five million employees at 150,000 companies averaged monthly at ¥18,192 per employee, a significant increase of more than 20% compared to the previous year. In fiscal 2019, the average had been ¥23,383, the highest in 10 years. However, the COVID-19 pandemic led to people refraining from entertaining and so, in fiscal 2021, it fell to ¥16,653, the lowest it had been in a decade.
For companies that had already declared their 2023 financial results as of November, the average entertainment expenses per employee were shown to be approximately ¥18,400 per month, leading to the possibility that this spending could recover to around 90% of the amount for fiscal 2019, which had been the highest level prior to the pandemic.
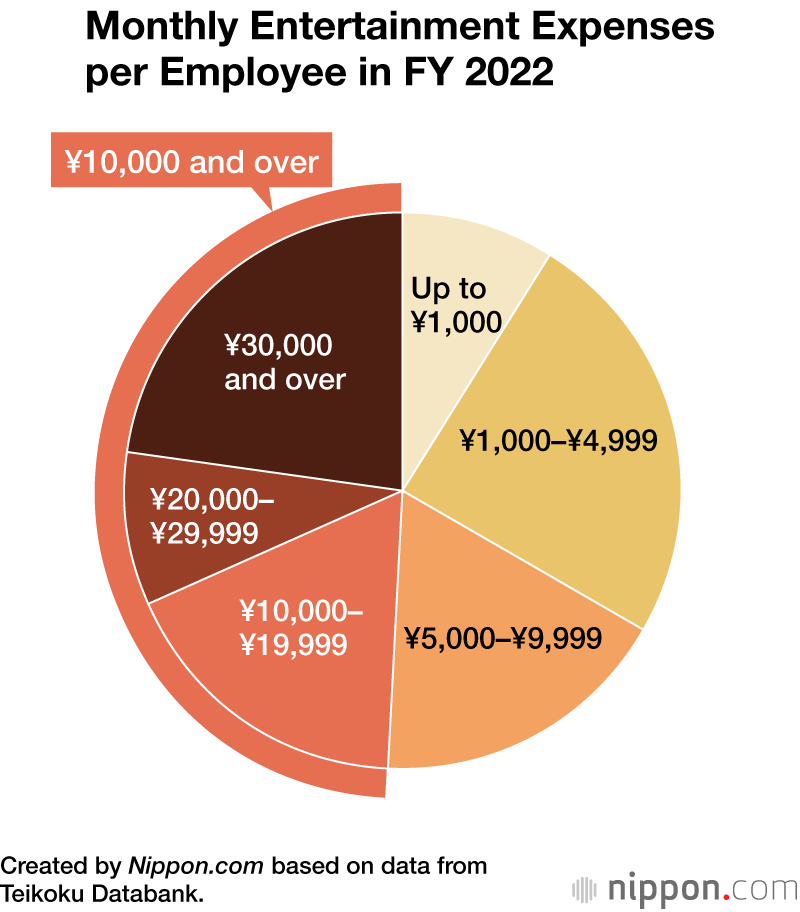
By amount of expenditure, at 24.7%, companies most commonly spent “¥1,000–¥4,999” per employee in 2022. Overall, 50.9% of total respondents answered, “less than ¥10,000,” while a combined 49.1% said “more than ¥10,000,” revealing an almost even divide at the ¥10,000 mark.
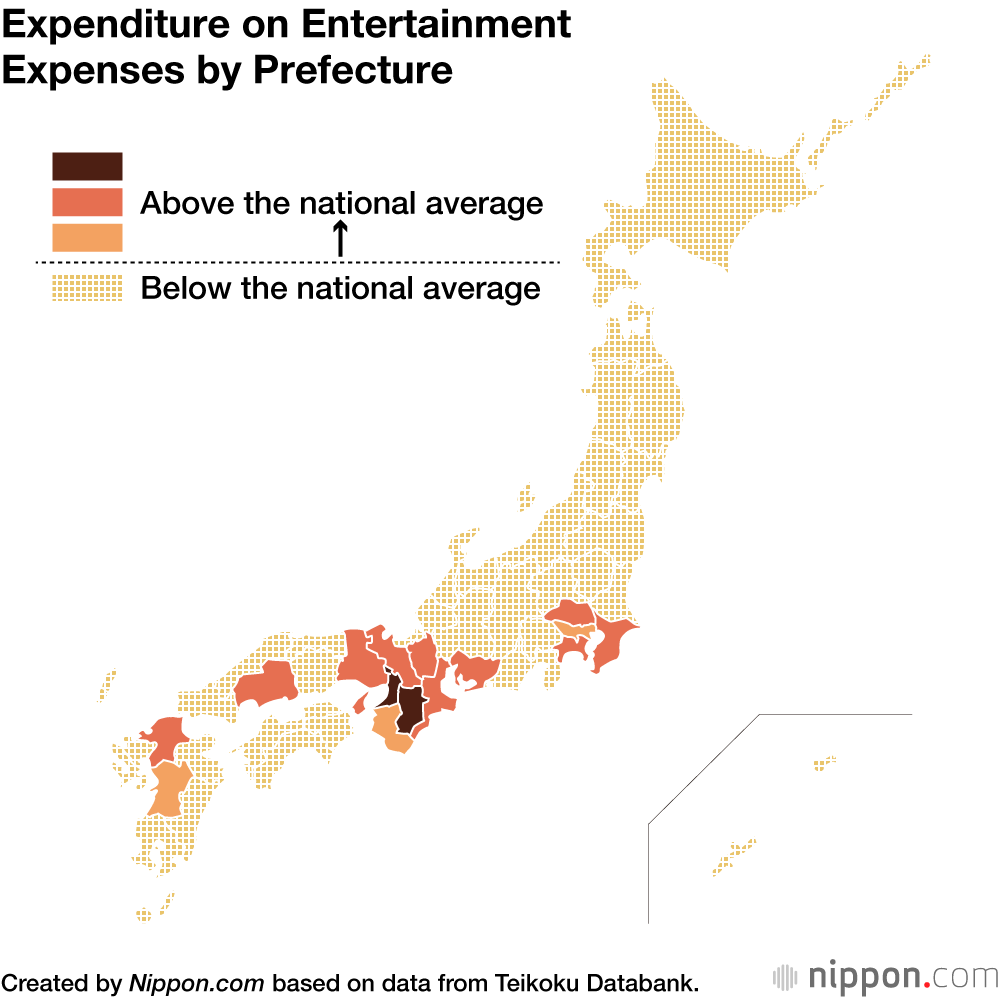
By industry, at ¥59,515 per employee, real estate had the highest spending for entertainment expenses in 2022. One factor for this was thought to be because of the broad range of personnel exchanges within the industry, such as with the construction companies they worked with as well as with management companies. Among the eight industries that paid more than ¥20,000 per employee each month were “construction work by specialist contractor” (¥29,000) and “motor vehicle and bicycle retail” (¥23,707). By prefecture, Osaka had the highest amount of spending at ¥28,324, followed by Nara with ¥25,366, and Fukuoka ¥23,732, indicating a tendency for companies in the Kansai region and further west having a higher expenditure on entertainment expenses.
Industries with Significant Expenditure on Entertainment Expenses (FY2022)
| Highest by Industry | Entertainment expenditure/month (¥) |
|---|---|
| Real estate | 59,515 |
| Construction work by specialist contractors | 29,000 |
| Motor vehicle and bicycle retail | 23,707 |
| Professional services (e.g. accounting office buildings) | 22,549 |
| Installation work | 21,919 |
Created by Nippon.com based on data from Teikoku Databank.
(Translated from Japanese. Banner photo © Pixta.)