Japan’s Population Falls Again in 2024
Society- English
- 日本語
- 简体字
- 繁體字
- Français
- Español
- العربية
- Русский
Japan’s population was 124,330,690, as of January 1, 2025, after a 0.44% year-on-year decrease, according to a demographic survey published by the Ministry of Internal Affairs and Communications.
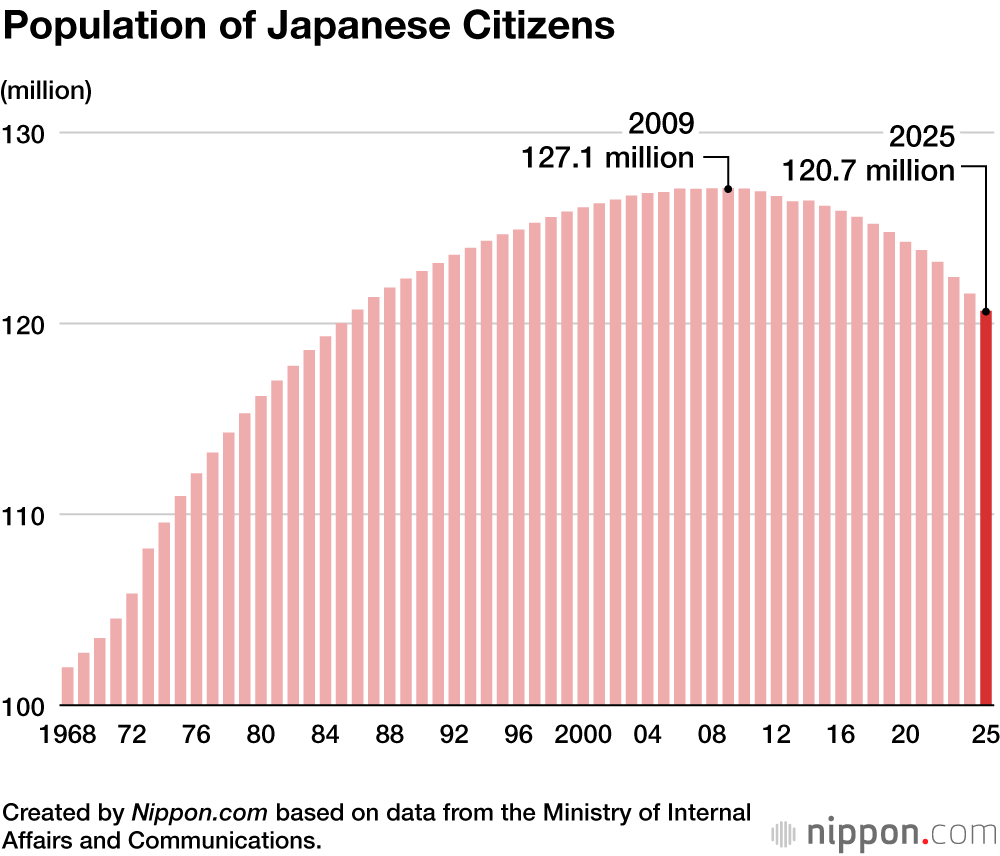
The number of Japanese citizens was 120,653,227, down 908,574 or 0.75% year on year. Since 2009, the number of Japanese citizens has fallen for 16 consecutive years. While the Japanese population in Tokyo rose by 16,825 or 0.13%, it fell in all 46 other prefectures. The largest decreases were mainly in the north of Tōhoku: 1.91% in Akita, 1.72% in Aomori, and 1.69% in Iwate. There was also a 1.71% drop in the Shikoku prefecture of Kōchi.
Japan had 687,689 births in 2024, marking the ninth consecutive record low year and the first time for the figure to fall below 700,000. The natural population decline, calculated by subtracting births from deaths, increased to 912,161, rising for the seventeenth straight year.
Meanwhile, there were 3,677,463 non-Japanese residents, a year-on-year increase of 354,089 or 10.7%, due to factors including the greater ease of movement to Japan since the 2023 relaxation of the entry restrictions that had been in place during the COVID-19 pandemic. This was the highest total since statistics were first compiled in 2013. As a result, the overall population fell by some 550,000 in 2024.
The prefecture with the highest population (including Japanese and non-Japanese) was Tokyo with 14,002,534 residents, followed by Kanagawa at 9,202,559, and Osaka at 8,771,961. The least populated prefecture was Tottori, with just 534,003 residents.
The total population of the three major metropolitan areas centered on Tokyo, Osaka, and Nagoya was 66,008,727, declining for the fifth consecutive year, but still representing 53.1% of the total population. The concentration of foreign residents in metropolitan areas is even more pronounced, with 68.6% of the total population living there.
Prefectures with the Highest and Lowest Populations (All Residents)
| Tokyo | 14,002,534 | Tottori | 534,003 |
| Kanagawa | 9,202,559 | Shimane | 642,590 |
| Osaka | 8,771,961 | Kōchi | 664,863 |
| Aichi | 7,483,755 | Tokushima | 700,409 |
| Saitama | 7,374,294 | Fukui | 746,690 |
| Chiba | 6,311,579 | Saga | 794,252 |
| Hyōgo | 5,393,607 | Yamanashi | 801,056 |
| Fukuoka | 5,086,957 | Wakayama | 901,193 |
| Hokkaidō | 5,044,825 | Akita | 907,593 |
| Shizuoka | 3,575,704 | Kagawa | 939,965 |
Created by Nippon.com based on data from the Ministry of Internal Affairs and Communications.
Prefectures with the Highest and Lowest Populations (Non-Japanese)
| Tokyo | 721,223 | Akita | 5,753 |
| Osaka | 328,128 | Tottori | 6,005 |
| Aichi | 321,905 | Kōchi | 6,661 |
| Kanagawa | 284,889 | Aomori | 8,415 |
| Saitama | 257,656 | Tokushima | 8,769 |
| Chiba | 227,013 | Wakayama | 10,032 |
| Hyōgo | 140,102 | Yamagata | 10,318 |
| Shizuoka | 120,111 | Shimane | 10,455 |
| Fukuoka | 111,461 | Iwate | 11,163 |
| Ibaraki | 100,188 | Saga | 11,175 |
Created by Nippon.com based on data from the Ministry of Internal Affairs and Communications.
Data Sources
- Demographic survey (Japanese) from the Ministry of Internal Affairs and Communications.
(Translated from Japanese. Banner photo © Pixta.)