Aging Consumers Reshaping Japanese Market
Consumption Patterns of Japan’s Elderly
Economy Society- English
- 日本語
- 简体字
- 繁體字
- Français
- Español
- العربية
- Русский
Senior Consumption Trends Upward
Despite broader stagnation, consumption by elderly people has trended upward for more than a decade. I have estimated that the consumption expenditures of households of people aged 60 and older have grown by an annual average of 3.1% between 2003 and 2014. Such growth averaged 4.4% between 2010 and 2014, sustaining overall personal consumption in the years after the global economic crisis.
Senior consumption, defined as the consumption of households where the head of the household is aged 60 or older, was estimated at ¥115 trillion in 2014. This is 48% of overall personal consumption(*1) and corresponds to 24% of nominal GDP (figure 1).
This impressive figure for senior consumption, however, merely reflects demographic changes that have occurred over the years. Meanwhile, the consumption expenditures of younger households have fallen sharply. The consumption of households whose heads are younger than 60 declined by an annual average of 1.9% between 2003 and 2014. Taken as a whole, personal consumption is stagnant, recording annual growth of just 0.1% between 2003 and 2014.
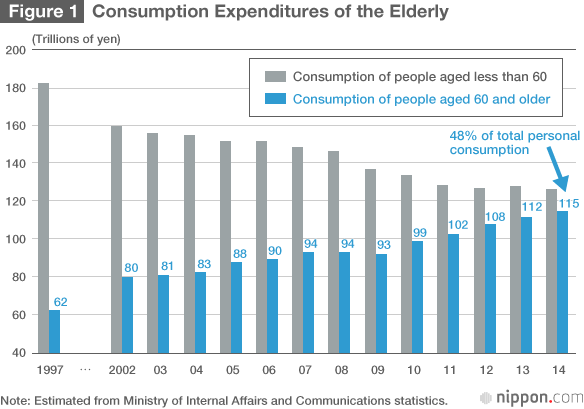
The increase of senior consumption is a result of the rising share of elderly people in Japan’s population. Only senior consumption is growing and not consumption as a whole.
On a household basis, the average monthly consumption of households aged less than 60 is ¥275,000, exceeding the ¥230,000 of households aged 60 and older. Most households aged less than 60 are worker households, and most households aged 60 and older consist of retirees. As household ages increase, high-income households of people in their 50s gradually become households of people aged 60 and older, causing average consumption per household to decline. The graying of society in Japan is placing downward pressure on economic growth.
Theoretically, rising income for households aged 60 and older could drive economic growth. It is, however, difficult to envision senior consumption increasing in a future where social security benefits are reduced. While the public pension system allows for the cost-of-living adjustment of benefits, this increase is adjusted downward in accordance with certain macroeconomic indicators. As a result, the purchasing power of retiree households can be expected to decline as prices rise.
A Future of Declining Personal Consumption
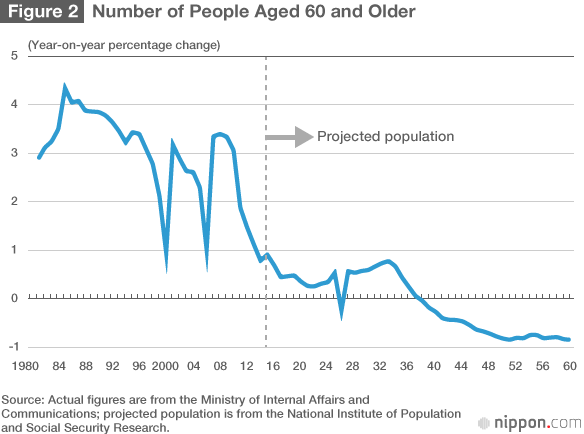
While senior consumption has trended upward, will this trend continue into the future? To answer this question, it will be useful to examine the projection for the number of people aged 60 and older in the Population Projection of Japan by the National Institute of Population and Social Security Research. This age cohort is projected to grow by an annual average of 0.4% from 2017 to 2025 (figure 2). The baby boomer generation born between 1947 and 1949 has driven the growth of the elderly population, but with fewer babies born five years after this generation, this growth is certain to slow.
 <
<
img class="aligncenter size-full wp-image-27312" src="/kiji_contents_root/image_data/2018/12/13/42343/42343.png?20181213041213" alt="" width="650" height="390">
A breakdown of senior consumption for 2014 reveals that such consumption gradually falls as age cohorts increase in age to 70 years and older (figure 3). This is a consequence of the decline of average consumption per household as households grow older.
A matter of concern is the ongoing contraction of the working age population between the ages of 20 and 59. The growth of this age cohort turned negative in 2000, and the cohort has rapidly shrunk from around the time of the 2008–09 global recession.
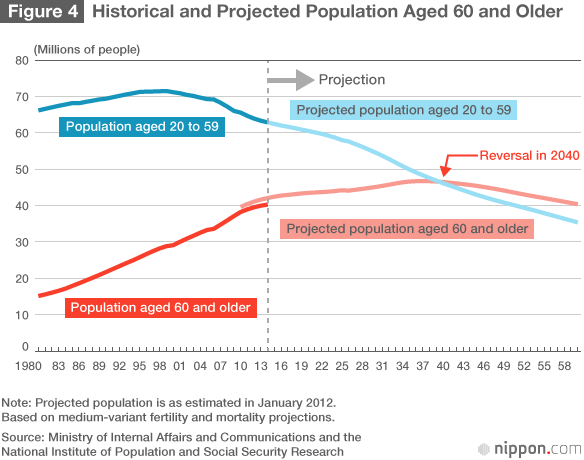
Japan is facing a future where the elderly population stops growing and the working age population contracts at an accelerated pace (figure 4). Some analysts argue that this situation can be dealt with by increasing immigration. However, since the population will contract by 400,000 to 600,000 people annually between 2015 and 2020, it will not be technically possible to absorb such a number of immigrants each year. In this context, it would be heartless to ask the elderly with future uncertainties to draw down their savings so as to boost consumption for the future of Japan’s economy.
Food the Largest Consumption Expenditure
Japan’s households number 50.43 million, of which 25.66 million, or 50.9%, have heads of households aged 60 or older.(*2) Distinguishing features of elderly households are the large number of one-person households and the high share of single female households. As Japanese people enjoy longer lives, the average life span of females rose to 86.8 years in 2014. Two out of three one-person households consist of females.
What are the consumption patterns of seniors who live alone? Given that consumption trends differ greatly by household income, I made a comparison with people under 30 living alone since their income and consumption are similar (Table 1). The monthly consumption expenditures of one-person households aged 70 and above averaged ¥147,000 for males and ¥154,000 for females. At the same time, since their annual income exceeds consumption, it appears that the elderly are continuing to save.
Table 1: Monthly Income and Expenditures per Household
Male one-person households (yen/month)
| Average | Aged less than 30 | Aged 70 and older | |
|---|---|---|---|
| Age | 53.1 | 25.6 | 77.6 |
| Consumption expenditures | 172,278 | 155,619 | 146,821 |
| Food | 44,279 | 37,167 | 37,012 |
| Housing | 27,592 | 39,118 | 15,508 |
| Fuel, light, and water | 10,465 | 7,882 | 12,520 |
| Clothing and footwear | 5,305 | 5,117 | 3,277 |
| Medical care | 5,278 | 1,194 | 7,203 |
| Transportation | 6,280 | 7,700 | 3,894 |
| Communication | 7,494 | 6,808 | 5,522 |
| Culture and recreation | 23,260 | 24,610 | 20,162 |
| Social expenses | 12,049 | 8,530 | 14,786 |
| Income | 304,083 | 299,750 | 218,250 |
| Current savings (thousands of yen) | 10,847 | 1,926 | 14,354 |
| Current liabilities (thousands of yen) | 2,025 | 2,699 | 477 |
| Home owner ratio (%) | 50.9 | 9.3 | 77.5 |
Female one-person households (yen/month)
| Average | Aged less than 30 | Aged 70 and older | |
|---|---|---|---|
| Age | 63.3 | 24.7 | 77.2 |
| Consumption expenditures | 167,163 | 161,811 | 154,146 |
| Food | 34,920 | 27,100 | 33,170 |
| Housing | 20,184 | 42,447 | 15,432 |
| Fuel, light, and water | 11,614 | 8,486 | 12,255 |
| Clothing and footwear | 9,107 | 9,072 | 6,999 |
| Medical care | 8,351 | 3,239 | 8,358 |
| Transportation | 4,566 | 5,834 | 3,462 |
| Communication | 6,828 | 9,669 | 5,231 |
| Culture and recreation | 19,165 | 19,199 | 18,335 |
| Social expenses | 18,814 | 7,057 | 22,033 |
| Income | 214,917 | 232,417 | 178,500 |
| Current savings (thousands of yen) | 12,149 | 1,449 | 13,373 |
| Current liabilities (thousands of yen) | 767 | 784 | 382 |
| Home owner ratio (%) | 67.9 | 1.8 | 83.4 |
Source: National Survey of Family Income and Expenditure 2014, Ministry of Internal Affairs and Communications
Expenditures on food represent the largest consumption item of the elderly. Engel’s coefficient, or the proportion of income spent on food, is said to be high for elderly people, but the young people in the survey spent a similar amount. Where food expenditures differ is in the food that is bought. The elderly prefer fresh fish, fresh vegetables, and fresh fruits. In contrast, young singles spend less on such items and more on eating out. This tendency also holds for households of two or more people.
High Medical and Social Spending
Of their consumption expenditures, the elderly devote smaller shares for housing, clothing and footwear, and transportation expenses. They spend less on housing since more of them own their own homes. With a lower home owner ratio than the elderly, young people assign a considerable portion of the household budget to rent. Elderly males spend hardly anything on clothing or shoes. Their low transportation expenses are likely explained by the substantial amount of time they spend walking rather than traveling by vehicle. Males aged 70 and older walk an average of 37 minutes per day on weekdays,(*3) a far higher figure than the overall average of 25 minutes. Clearly the elderly are seeking to maintain their health by walking on a regular basis.
On the subject of health, elderly people’s medical care expenses are high. Not only do the elderly spend more on pharmaceuticals and doctor visits than young people, but the amount they spend on health maintenance products (health foods and supplements) is second only to what they spend on the former. Seniors must devote a lot of time and money to staying healthy.
The elderly are often viewed as enjoying active lives of leisure, filled with travel and shopping. This image, however, is most likely the product of extensive marketing efforts by companies hoping to sell them products and services. Certainly, there are many people who spend their money eagerly on travel packages and lodging in the first half of their 60s. As they increase further in age, however, the elderly tend to cut back on expenditures for culture and recreation.
A somewhat surprising finding is the gradual decrease of their own culture and recreation expenditures even as social expenses—spending on people outside their households—remain high. While young people spend very little on social expenses, many elderly spend about the same amount as during their working years. Gifts represent a major component of social expenses. The elderly spend freely on their grandchildren, and it is possible that such spending is included in social expenses. It may also be that the elderly are more willing to pick up the tab when they get together with other people. An interesting detail is food expenditures in social expenses being higher for females than males.
Fears of Insolvency
Finally, it will be useful to examine the economic divide the elderly face, which is usually understood as inequality ensuing from the lack of equal opportunity for people with the will to work to demonstrate their abilities. Opinion, however, is divided regarding inequality of outcomes. The argument is made that people should not find life difficult when they grow old if they work hard while young.
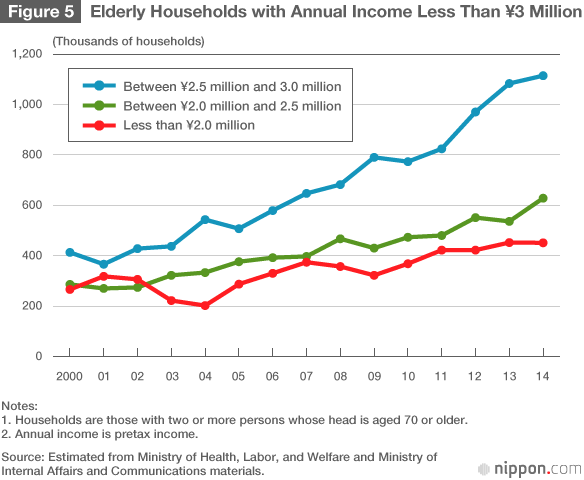
With the aging of society, the inequality of outcomes is becoming a major problem in Japan. For example, 54% of people aged 70 and older have annual incomes less than ¥2 million.(*4) This low income group falls to 17% of people between the ages of 65 and 69 and 11% of people between the ages of 60 and 64. The concentration of people 70 years and older with low incomes highlights that many elderly can no longer count on wage income and are totally dependent on public pension benefits.
Viewed over time, the number of households headed by people aged 70 and older with total annual incomes less than ¥2 million have grown 1.4 times to 450,000 from 320,000 five years ago and 2.2 times from 200,000 ten years ago (figure 5). When employment conditions worsened in the past, many young people lost their jobs and fell into the low-income bracket. More recently, the number of young people with low incomes has declined. Rather, it is people aged 70 and older who are sinking to the low-income bracket from losing the ability to work and from being totally dependent on the public pension. The much discussed issue of old-age insolvency can be viewed as an indicator of the number of elderly running into financial difficulties as a result of pension benefits falling short of what they need.
The government has recently announced the goal of building a society where everyone can take an active part. To make this more than an agreeable slogan, it would be appropriate for the government to take the lead in providing opportunities so people aged 70 and older do not face hardships. One approach would be for public institutions to create employment opportunities to enable people still in their 50s and 60s to find work through voluntary effort. There are limits to what can be done in providing public assistance to people after they reach retirement age. Japan will need to flexibly adjust its social design to conform with an aging society.
(Originally written in Japanese and published on November 6, 2015. Banner photo: © Jiji.)
(*1) ^ Final consumption expenditures of households excluding imputed rent.
(*2) ^ Comprehensive Survey of Living Conditions 2014, Ministry of Health, Labor, and Welfare.
(*3) ^ Japanese Time Use Survey 2010, NHK Broadcasting Culture Research Institute.
(*4) ^ Family Income and Expenditure Survey of Households of Two or More People 2014, Ministry of Internal Affairs and Communications.
consumption aging senior baby boomers old-age insolvency personal consumption